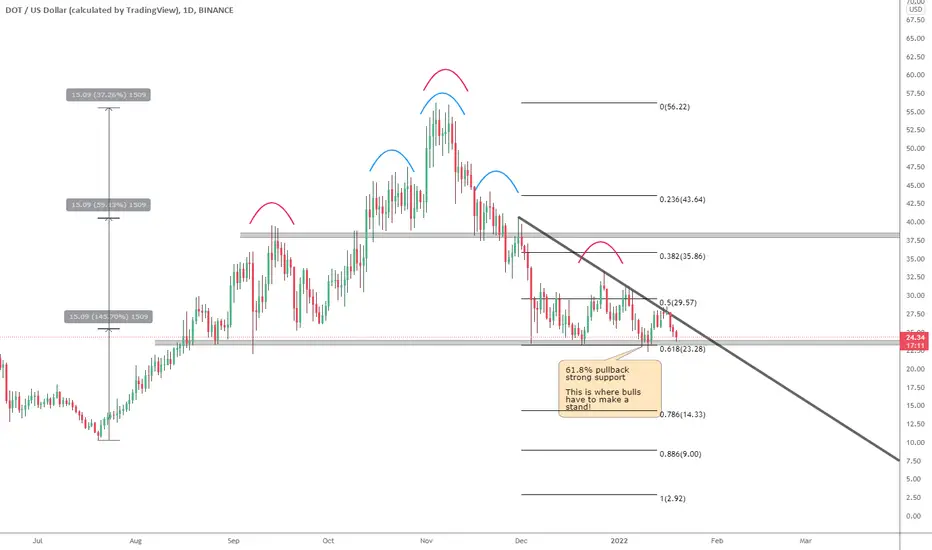
DOT´s chart is so symmetrical that it almost looks fake.
The uptrend from July/21 can be divided in 3 almost identical parts with a strong resistance/support level between each one of them.
We also have a small head and shoulders (H&S) pattern (blue) that was broken took us from one level to the next one.
Now, we´re testing the neckline of a larger H&S pattern (red). Breaking this could be disastrous and take us down to the low 10´s (or not so disastrous if you´re a futures trader and take a short leveraged trade).
Since this is also 61.8% pullback from the whole DOT lifecycle, this could be a tough one for bears to crack. The black trendline is key for bulls. I won´t take any trades until support or trendline are broken.
📈 Experienced Crypto trader
👍 Simple, actionable content
🌊 Elliott Wave junkie
🧠 Trading psychology hacks
🎖️ Premium VIP Discord Server ($4.99/mth for a limited time - check link below)
linktr.ee/stoic.trader
👍 Simple, actionable content
🌊 Elliott Wave junkie
🧠 Trading psychology hacks
🎖️ Premium VIP Discord Server ($4.99/mth for a limited time - check link below)
linktr.ee/stoic.trader
Penafian
Maklumat dan penerbitan adalah tidak dimaksudkan untuk menjadi, dan tidak membentuk, nasihat untuk kewangan, pelaburan, perdagangan dan jenis-jenis lain atau cadangan yang dibekalkan atau disahkan oleh TradingView. Baca dengan lebih lanjut di Terma Penggunaan.