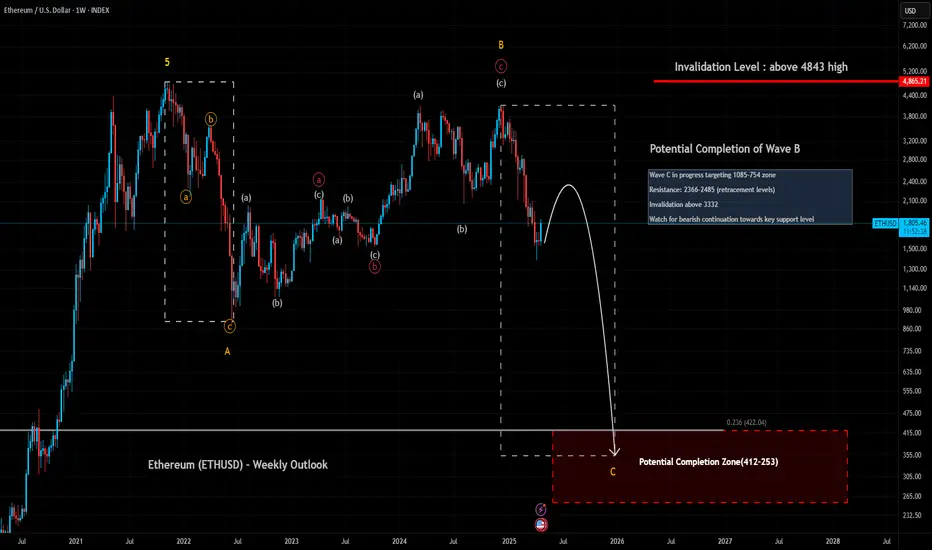
On the weekly chart, Ethereum appears to have completed a corrective Wave B inside the larger flat structure.
We are now monitoring the beginning stages of Wave C downward, following the major B top.
Immediate resistance levels are seen around $2366 and $2485 zones (0.5 and 0.618 retracement).
Key support is aligned with the $1085 level as the first major zone.
📈 For a broader context, please refer to my Monthly Ethereum analysis.
📉 For more tactical short-term entries, check my Daily Ethereum analysis.
#Ethereum #ETH #WeeklyChart #TechnicalAnalysis #ElliottWave #CryptoTrading #BearishScenario
Penafian
Maklumat dan penerbitan adalah tidak dimaksudkan untuk menjadi, dan tidak membentuk, nasihat untuk kewangan, pelaburan, perdagangan dan jenis-jenis lain atau cadangan yang dibekalkan atau disahkan oleh TradingView. Baca dengan lebih lanjut di Terma Penggunaan.
Penafian
Maklumat dan penerbitan adalah tidak dimaksudkan untuk menjadi, dan tidak membentuk, nasihat untuk kewangan, pelaburan, perdagangan dan jenis-jenis lain atau cadangan yang dibekalkan atau disahkan oleh TradingView. Baca dengan lebih lanjut di Terma Penggunaan.