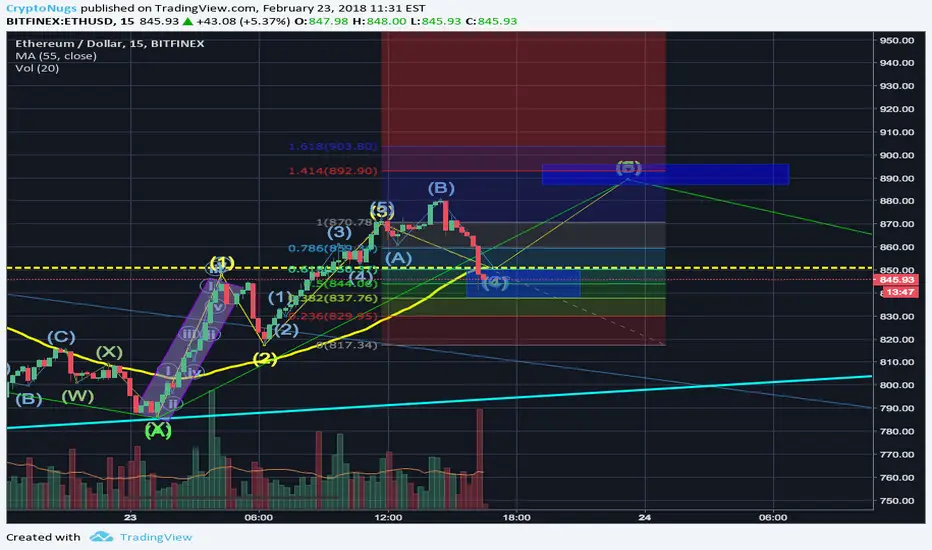
The large sub B wave I'm seeing is within the C leg of the overall ETH correction we've been seeing since early January.
In my analysis I see indicators of a return to bull market, but that is trademark B wave behavior and psychology and in the larger picture fits nicely into the overall correction.
This small run is outlined in more detail in smaller minutes, however only 15min view is available.
Blue boxes indicate bounce/support/trap zones.
I will post corrections/ clarifications as time goes on today.
Penafian
Maklumat dan penerbitan adalah tidak dimaksudkan untuk menjadi, dan tidak membentuk, nasihat untuk kewangan, pelaburan, perdagangan dan jenis-jenis lain atau cadangan yang dibekalkan atau disahkan oleh TradingView. Baca dengan lebih lanjut di Terma Penggunaan.
Penafian
Maklumat dan penerbitan adalah tidak dimaksudkan untuk menjadi, dan tidak membentuk, nasihat untuk kewangan, pelaburan, perdagangan dan jenis-jenis lain atau cadangan yang dibekalkan atau disahkan oleh TradingView. Baca dengan lebih lanjut di Terma Penggunaan.