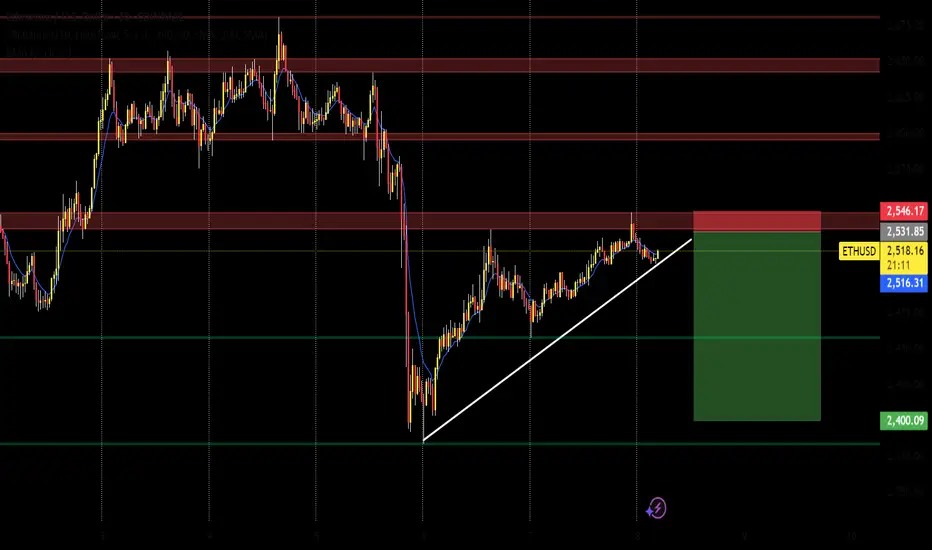
Price is testing a major resistance zone (2531–2546) after a short-term uptrend. A rejection here could trigger a move down to the 2400 support area. Clean risk-reward with SL above resistance. Confirmation needed – watch for trendline break or bearish candle pattern.
Asset: ETH/USD
Trend Bias: Bearish (based on the setup)
Chart Structure:
Price is approaching a resistance zone around 2531–2546 (marked in red).
Ascending trendline (white) indicates recent bullish momentum.
Short position is being considered right at/near the resistance level.
📉 Trade Setup (Short):
Entry Zone: Around 2531.85–2546.17
Stop Loss (SL): Above 2546.17
Take Profit (TP): Around 2400.09
Risk-Reward Ratio: Roughly 1:3, which is favorable.
📌 Supporting Signals:
Price is testing a supply zone/resistance block.
EMA is flattening, showing momentum slowing.
Previous sharp drop from this zone shows strong seller presence.
Trendline break could confirm bearish entry.
🛑 Caution:
If price breaks above 2546, setup is invalid.
Watch for confirmation (e.g., bearish engulfing or break of trendline) before entering.
Follow Me
Get Accurate Forex & Gold Signals Daily!
Join our trusted trading team with real-time insights and expert support.
Start your winning journey now
Join our trusted trading team with real-time insights and expert support.
Start your winning journey now
Penafian
Maklumat dan penerbitan adalah tidak dimaksudkan untuk menjadi, dan tidak membentuk, nasihat untuk kewangan, pelaburan, perdagangan dan jenis-jenis lain atau cadangan yang dibekalkan atau disahkan oleh TradingView. Baca dengan lebih lanjut di Terma Penggunaan.