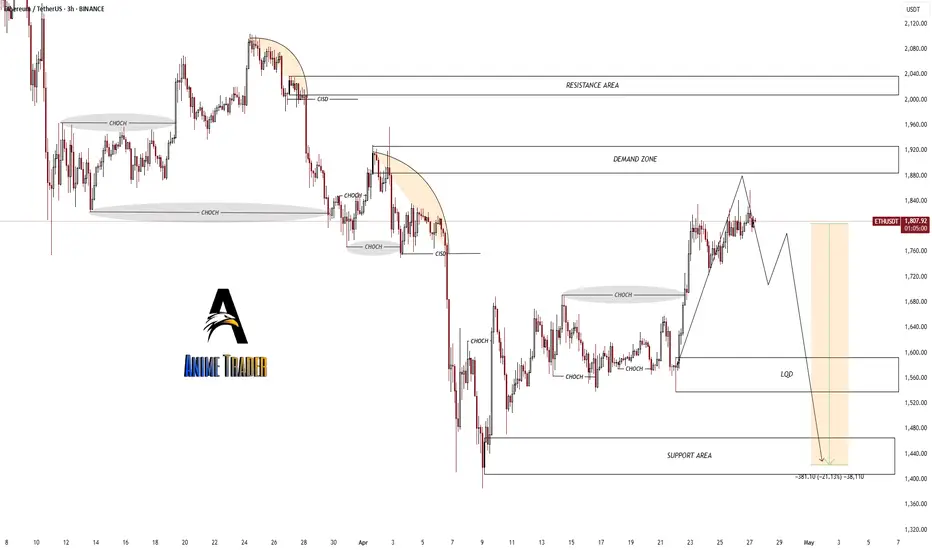
Ethereum (ETH) vs Tether (USDT)* on the 3-hour (3h) timeframe.
- The analysis seems *smart money concept (SMC)*-based again, very similar to the previous NZD/USD chart.
1. Tools and Concepts Used:
CHOCH (Change of Character): Marked several times where the market trend shifted.
CSB (Continuation Shift Break)*: This shows the continuation after a CHOCH, confirming trend direction.
Demand Zone*: Marked above — an area where price might react and bounce.
Resistance Area*: Clearly marked at the top — where price could face selling pressure.
Support Area*: Marked at the bottom — where buying might be expected.
Liquidity Zone (LQD)*: Target zone where liquidity is expected to be taken before a potential reversal.
Projected Moves: Future price path drawn using zigzag lines (anticipating market behavior based on liquidity sweeps and structure).
2. Patterns Used:
Supply and Demand Dynamics*: Heavy focus on how price reacts at supply (resistance) and demand (support) zones.
Liquidity Sweep Setup: Anticipation of price dropping into liquidity zones before reversing.
3. Style of Analysis:
Smart Money Concepts (SMC)*: Focused on liquidity, CHOCH, demand zones, BOS (Break of Structure), and liquidity sweeps — all textbook SMC techniques.
Institutional Order Flow Trading*: Understanding where larger players (institutions) might step in.
Both of your charts are following a *professional SMC/ICT (Inner Circle Trader)* style of analysis.
Would you also like me to explain how you could structure a short setup from this ETH chart based on the flow? Could even sketch a mini plan if you want!
Penafian
Maklumat dan penerbitan adalah tidak dimaksudkan untuk menjadi, dan tidak membentuk, nasihat untuk kewangan, pelaburan, perdagangan dan jenis-jenis lain atau cadangan yang dibekalkan atau disahkan oleh TradingView. Baca dengan lebih lanjut di Terma Penggunaan.
Penafian
Maklumat dan penerbitan adalah tidak dimaksudkan untuk menjadi, dan tidak membentuk, nasihat untuk kewangan, pelaburan, perdagangan dan jenis-jenis lain atau cadangan yang dibekalkan atau disahkan oleh TradingView. Baca dengan lebih lanjut di Terma Penggunaan.