Current Indicators:
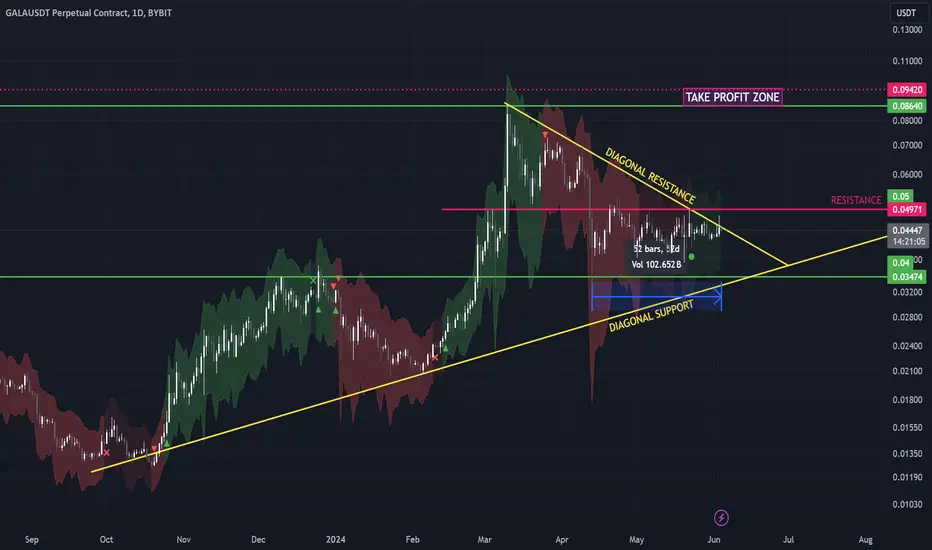
Weekly Support: We are currently above the weekly support level at $0.03474.
Yellow Diagonal Support Trendline: The price is holding above the yellow diagonal support trendline.
Accumulation Zone: We've had 52 days of price accumulation, with the price bouncing within a range.
Momentum Indicator: The "Squeeze Momentum TD - A Revisited Version of the TTM Squeeze" is currently dark green, indicating a mildly bullish sentiment.
Overall Trend: We are in an overall uptrend.
What's Missing for Confirmation:
Break Above Diagonal Yellow Resistance Trendline: We need to see a break above this key resistance level.
Break Above Key Resistance at $0.04971: Clearing this resistance would further confirm a bullish trend.
Target Price (TP) Zone:
TP Zone: $0.09 area
Conclusion:
If we break above both the diagonal yellow resistance trendline and the key resistance at $0.04971, this presents a very good long opportunity. Keep an eye on these levels for confirmation.
Tik Tok: @tradingparadise.io
Penafian
Maklumat dan penerbitan adalah tidak dimaksudkan untuk menjadi, dan tidak membentuk, nasihat untuk kewangan, pelaburan, perdagangan dan jenis-jenis lain atau cadangan yang dibekalkan atau disahkan oleh TradingView. Baca dengan lebih lanjut di Terma Penggunaan.
Tik Tok: @tradingparadise.io
Penafian
Maklumat dan penerbitan adalah tidak dimaksudkan untuk menjadi, dan tidak membentuk, nasihat untuk kewangan, pelaburan, perdagangan dan jenis-jenis lain atau cadangan yang dibekalkan atau disahkan oleh TradingView. Baca dengan lebih lanjut di Terma Penggunaan.