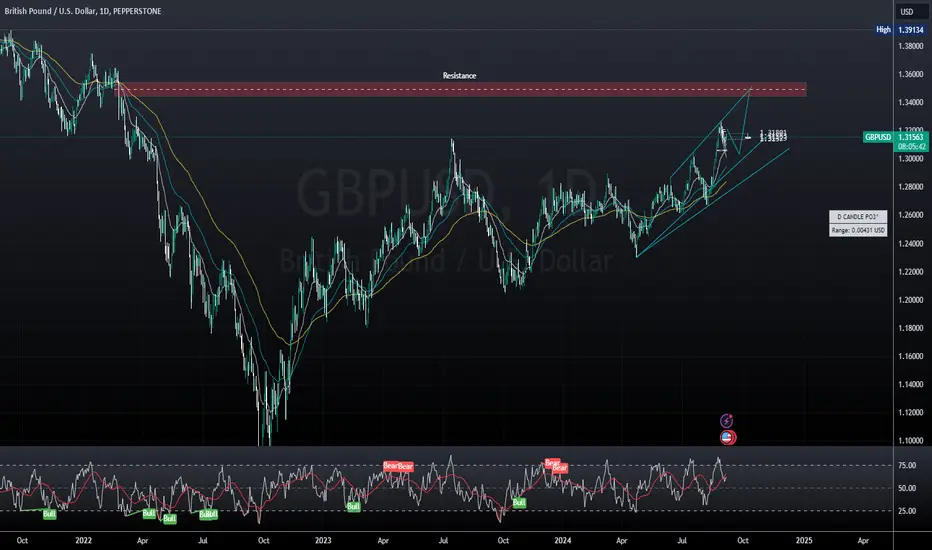
The daily chart for GBP/USD reveals a clear uptrend with price action forming a bullish channel. The pair is currently trading around 1.31621, approaching a critical resistance zone.
Key Levels:
Resistance Zone:
The price is heading towards a major resistance around 1.39, a level which has historically acted as a strong ceiling. This resistance could halt the upward movement unless a significant breakout occurs.
Support Levels:
The lower trendline of the channel is acting as dynamic support. If the price retraces, the 1.30 level should provide a cushion for potential buying pressure, maintaining the bullish trend.
Trading Strategy:
Buying Strategy:
Traders can look for a pullback to the lower boundary of the channel around 1.30 for a potential buying opportunity. A stop loss can be placed just below the trendline, targeting the resistance at 1.39.
Breakout Strategy:
A breakout above the 1.39 resistance would signal a continuation of the long-term bullish trend, opening up the possibility for further gains toward higher resistance levels.
RSI Confirmation:
The RSI indicator is approaching overbought territory but still has room to push higher. This suggests that the bullish momentum could continue until resistance is tested.
Conclusion:
With GBP/USD trading within a rising channel, the focus remains on how the price interacts with the 1.39 resistance level. A pullback to the lower trendline offers buying opportunities, while a breakout above resistance would signal further bullish potential.
Penerbitan berkaitan
Penafian
Maklumat dan penerbitan adalah tidak dimaksudkan untuk menjadi, dan tidak membentuk, nasihat untuk kewangan, pelaburan, perdagangan dan jenis-jenis lain atau cadangan yang dibekalkan atau disahkan oleh TradingView. Baca dengan lebih lanjut di Terma Penggunaan.
Penerbitan berkaitan
Penafian
Maklumat dan penerbitan adalah tidak dimaksudkan untuk menjadi, dan tidak membentuk, nasihat untuk kewangan, pelaburan, perdagangan dan jenis-jenis lain atau cadangan yang dibekalkan atau disahkan oleh TradingView. Baca dengan lebih lanjut di Terma Penggunaan.