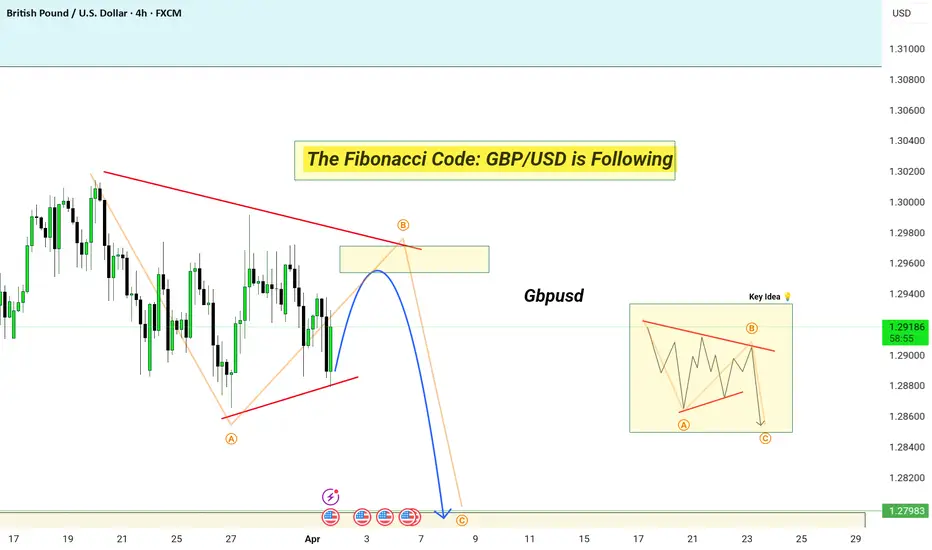
GBP/USD Elliott Wave Analysis: Bearish Setup Unfolding
In this 4-hour GBP/USD chart, we can see a classic Elliott Wave correction pattern forming. Price action is currently moving within a contracting triangle structure, with wave A and B shaping the market’s corrective movement before a potential impulsive wave C decline.
Key Observations:
✅ Wave Structure: The price is completing a wave B retracement into a key resistance area (yellow box), aligning with a supply zone.
✅ Converging Trendlines: A descending triangle is forming, confirming potential exhaustion in bullish momentum.
✅ Projected Move: If the pattern follows Elliott Wave principles, we anticipate a rejection from wave B’s peak, leading to a strong downward move toward the 1.2798 supply zone.
✅ Market Confluence: The confluence of resistance, supply zones, and wave structure increases the probability of a short setup.
📉 Trading Idea: If price reacts strongly from the marked resistance, a short position with a target near 1.2798 could offer a high-probability trade opportunity.
Let me know your thoughts! Are you seeing the same setup? 🔥📊
Penerbitan berkaitan
Penafian
Maklumat dan penerbitan adalah tidak dimaksudkan untuk menjadi, dan tidak membentuk, nasihat untuk kewangan, pelaburan, perdagangan dan jenis-jenis lain atau cadangan yang dibekalkan atau disahkan oleh TradingView. Baca dengan lebih lanjut di Terma Penggunaan.
Penerbitan berkaitan
Penafian
Maklumat dan penerbitan adalah tidak dimaksudkan untuk menjadi, dan tidak membentuk, nasihat untuk kewangan, pelaburan, perdagangan dan jenis-jenis lain atau cadangan yang dibekalkan atau disahkan oleh TradingView. Baca dengan lebih lanjut di Terma Penggunaan.