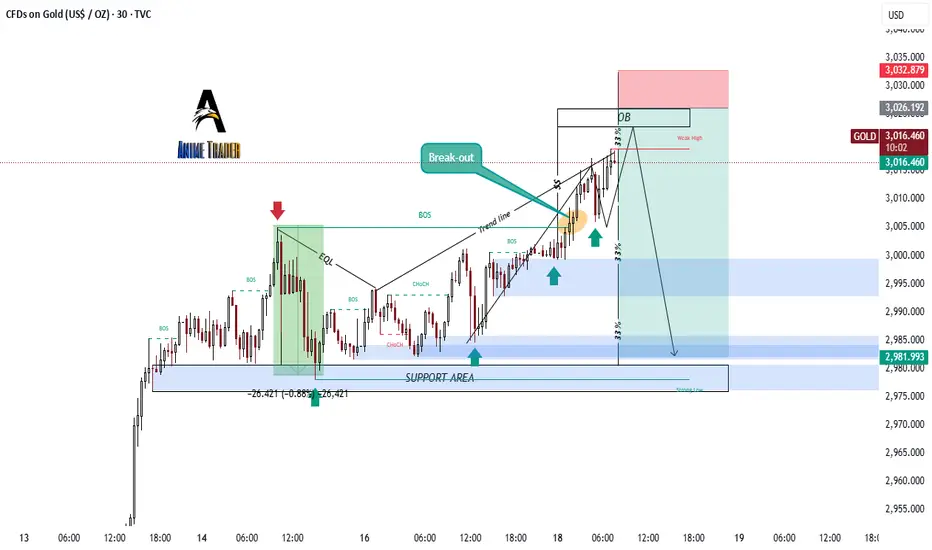
This chart is a technical analysis of Gold (XAU/USD) on a 30-minute timeframe. Here are the key elements visible:
1. *Support and Resistance Levels*
- A *support area* is marked at the bottom, indicating a price zone where buying interest is expected.
- The *weak high* and *order block (OB)* are identified at the top, suggesting a potential resistance area.
2. *Market Structure*
- *BOS (Break of Structure)* points indicate shifts in market momentum.
- *EQL (Equal Lows)* suggests liquidity zones where stop-loss orders might be resting.
- *Trendline* shows the market's upward movement before a possible reversal.
3. *Breakout and Rejection*
- The *breakout* label indicates a strong price movement above previous resistance.
- The *DB (Double Top or Distribution Block)* suggests a potential price reversal.
4. *Potential Trade Setup*
- The price is expected to drop from the *order block* area down toward the *support area*, indicated by the blue downward projection.
- The *red zone (stop-loss area)* and *blue zone (target area)* suggest a short-selling opportunity.
### Conclusion:
This chart suggests a bearish outlook after a strong bullish trend, expecting a price rejection from the *OB zone* and a drop toward lower support levels. Traders might look for sell entries near resistance with targets around the blue demand zone.
t.me/Xauusdanalysischartexperts
I deliver high-quality of forex signals and expert premium analysis updates, backed by meticulous analysis tools. and a commitment to exceptional results.
t.me/Xauusdanalysischartexperts
I deliver high-quality of forex signals and expert premium analysis updates, backed by meticulous analysis tools. and a commitment to exceptional results.
t.me/Xauusdanalysischartexperts
Penafian
Maklumat dan penerbitan adalah tidak dimaksudkan untuk menjadi, dan tidak membentuk, nasihat untuk kewangan, pelaburan, perdagangan dan jenis-jenis lain atau cadangan yang dibekalkan atau disahkan oleh TradingView. Baca dengan lebih lanjut di Terma Penggunaan.
t.me/Xauusdanalysischartexperts
I deliver high-quality of forex signals and expert premium analysis updates, backed by meticulous analysis tools. and a commitment to exceptional results.
t.me/Xauusdanalysischartexperts
I deliver high-quality of forex signals and expert premium analysis updates, backed by meticulous analysis tools. and a commitment to exceptional results.
t.me/Xauusdanalysischartexperts
Penafian
Maklumat dan penerbitan adalah tidak dimaksudkan untuk menjadi, dan tidak membentuk, nasihat untuk kewangan, pelaburan, perdagangan dan jenis-jenis lain atau cadangan yang dibekalkan atau disahkan oleh TradingView. Baca dengan lebih lanjut di Terma Penggunaan.