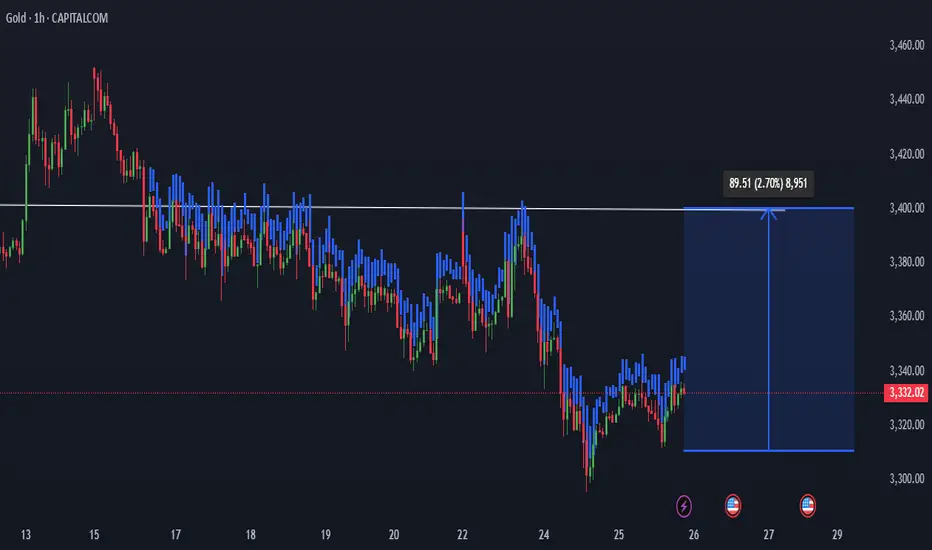
Current Price: ~$3,332
Resistance Level: ~3,400 (marked by the horizontal white line)
Potential Upside Target: Approximately 3,421
Expected Move: +89.51 points (+2.70%)
📈 Technical Interpretation:
Price Structure: After a recent downtrend, price appears to be forming a base and starting to bounce.
Bullish Breakout Potential: The blue shaded area suggests a bullish projection. If price breaks above the resistance (around 3,400), a move toward ~3,420+ is expected.
Volume Profile Overlay (Blue/Red Bars): Suggests historical volume concentration. Price might face resistance at the high-volume area (resistance line), but a breakout would signal strength.
✅ Bullish Scenario:
Entry Zone: Around current level (3,330–3,340), ideally on a breakout above 3,340.
Target: 3,420+
Risk: Breakdown below recent lows (~3,310–3,320) would invalidate the bullish idea
Penafian
Maklumat dan penerbitan adalah tidak dimaksudkan untuk menjadi, dan tidak membentuk, nasihat untuk kewangan, pelaburan, perdagangan dan jenis-jenis lain atau cadangan yang dibekalkan atau disahkan oleh TradingView. Baca dengan lebih lanjut di Terma Penggunaan.
Penafian
Maklumat dan penerbitan adalah tidak dimaksudkan untuk menjadi, dan tidak membentuk, nasihat untuk kewangan, pelaburan, perdagangan dan jenis-jenis lain atau cadangan yang dibekalkan atau disahkan oleh TradingView. Baca dengan lebih lanjut di Terma Penggunaan.
