TECHNICAL:
1.
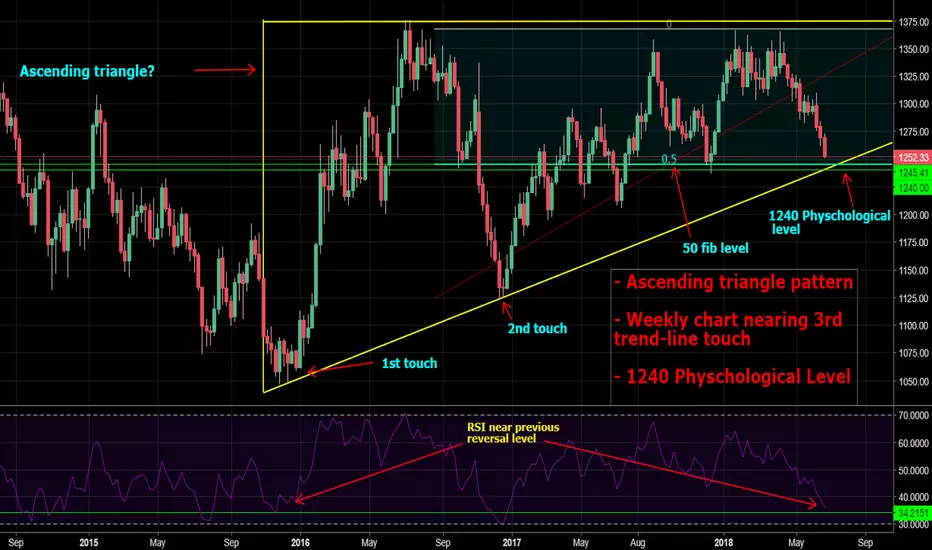
- Gold has been forming a possible Ascending Triangle pattern on the weekly chart since December 2015
- Price is now close to touching the ascending trend-line of the pattern for the 3rd time
2.
- RSI is nearing a level, at which the initial bullish reversal in the formation of the Ascending triangle pattern was seen
- RSI also extremely oversold on lower timeframes
3.
- 1240 Physchological level seen near the trendline so may be a possible level for reversal
4.
- 50 fib re-tracement of Bullish move from 18/12/2016 - 21/01/2018 coinicides with trendline resistance as well as Physchological level just below
FUNDAMENTALS:
- Alot of geopolitical tensions at the moment including:
- North Korea, still yet to confirm whether or not they will comply with Americas demands.
- US Trade war with China, Europe, India
STRAT:
- Set alarms for when price is 15-30 pips away from target price
- Wait to see what price action does around the 50 fib/1240 physchological level.
-Appreciate any thoughts, comments. Thanks for reading.
James .
1.
- Gold has been forming a possible Ascending Triangle pattern on the weekly chart since December 2015
- Price is now close to touching the ascending trend-line of the pattern for the 3rd time
2.
- RSI is nearing a level, at which the initial bullish reversal in the formation of the Ascending triangle pattern was seen
- RSI also extremely oversold on lower timeframes
3.
- 1240 Physchological level seen near the trendline so may be a possible level for reversal
4.
- 50 fib re-tracement of Bullish move from 18/12/2016 - 21/01/2018 coinicides with trendline resistance as well as Physchological level just below
FUNDAMENTALS:
- Alot of geopolitical tensions at the moment including:
- North Korea, still yet to confirm whether or not they will comply with Americas demands.
- US Trade war with China, Europe, India
STRAT:
- Set alarms for when price is 15-30 pips away from target price
- Wait to see what price action does around the 50 fib/1240 physchological level.
-Appreciate any thoughts, comments. Thanks for reading.
James .
Penafian
Maklumat dan penerbitan adalah tidak dimaksudkan untuk menjadi, dan tidak membentuk, nasihat untuk kewangan, pelaburan, perdagangan dan jenis-jenis lain atau cadangan yang dibekalkan atau disahkan oleh TradingView. Baca dengan lebih lanjut di Terma Penggunaan.
Penafian
Maklumat dan penerbitan adalah tidak dimaksudkan untuk menjadi, dan tidak membentuk, nasihat untuk kewangan, pelaburan, perdagangan dan jenis-jenis lain atau cadangan yang dibekalkan atau disahkan oleh TradingView. Baca dengan lebih lanjut di Terma Penggunaan.