This chart illustrates a bullish technical outlook for 
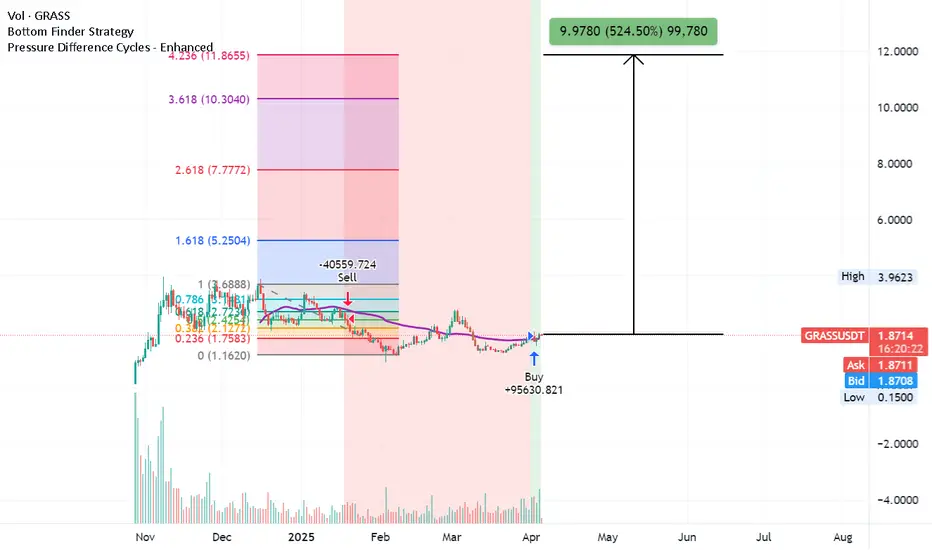
 GRASSUSDT using the Bottom Finder Strategy combined with Enhanced Pressure Difference Cycles and extended Fibonacci projections to forecast possible upside moves.
🔍 Key Observations:
Current Price: ~$1.87
Buy Signal Triggered: A confirmed buy emerged near $1.16 after a prolonged consolidation, backed by pressure reversal and volume support.
Sell Signal History: The previous major sell signal came in around $3.68 during a distribution top, capturing the local peak before the decline.
📐 Fibonacci Extension Levels:
1.618 → $5.25
2.618 → $7.77
3.618 → $10.30
4.236 → $11.86
🚀 Potential Rally Projection:
Price could surge to $9.9780, representing a 524.50% gain from the current level if momentum sustains.
📉 Volume Profile & Market Context:
Volume spiked around accumulation lows and has since stabilized — suggesting exhaustion of selling pressure. With the macro low printed and a fresh cycle beginning, risk/reward is asymmetrically in the bulls’ favor.
⚠️ Cautionary Note:
Although the setup is bullish, broader market volatility (including midterm political tension and possible regulatory shocks) could cause short-term pullbacks. As always, risk management is key.
🧠 Conclusion:
This is a high-reward setup worth watching closely — especially if we see confirmation of breakout volume above $2.50. Patience and positioning matter here.
Good luck to all! 📈🌱
Penafian
Maklumat dan penerbitan adalah tidak bertujuan, dan tidak membentuk, nasihat atau cadangan kewangan, pelaburan, dagangan atau jenis lain yang diberikan atau disahkan oleh TradingView. Baca lebih dalam Terma Penggunaan.
Penafian
Maklumat dan penerbitan adalah tidak bertujuan, dan tidak membentuk, nasihat atau cadangan kewangan, pelaburan, dagangan atau jenis lain yang diberikan atau disahkan oleh TradingView. Baca lebih dalam Terma Penggunaan.