While liquidity is drained from many altcoins and prices stagnate, HBAR is showing an impressive performance.
Will HBAR continue on to challenge its 2021 high and achieve a new ATH (All-Time High)? As a self-proclaimed Elliottician, there's one point that concerns me. This correction since December 3rd has been too prolonged—it's difficult to interpret it as a single wave cluster.
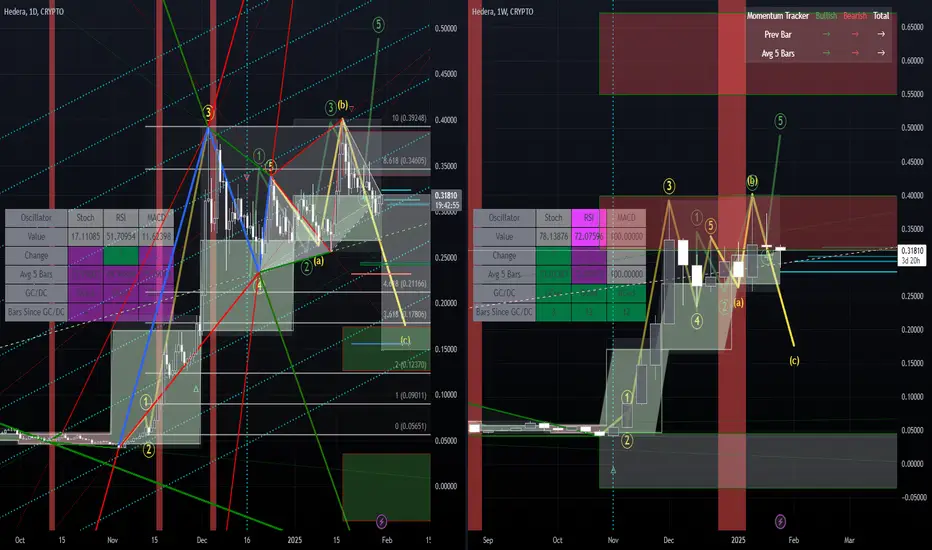
In one possibility, we might have already entered a new progressive wave (the circled green 1-2-3-4-5). However, it takes on the somewhat exceptional form of a leading expanding diagonal in that case.
If the bullish scenario takes an exceptional shape, let's also consider exceptions for the bearish (correction) scenario. In this case, isn't truncation a possibility? In other words, the high on Christmas might have been the end of the upward wave following a correction that could be WXYXZ as an impulsive wave 4. There are multiple possible ways of counting, but in this case, it's possible to count the high on January 17th as the B of an expanded flat—that is, the B as an irregular top.
Turning our eyes to the weekly chart, the red box clearly functions as a resistance zone, and it appears to have formed a double top. If candlesticks are pushed out from this resistance zone, it would be natural to anticipate movement in a downward direction.
Nevertheless, HBAR holders, including me, will simply accumulate more if the price drops, won't they? Will that opportunity present itself?
Will HBAR continue on to challenge its 2021 high and achieve a new ATH (All-Time High)? As a self-proclaimed Elliottician, there's one point that concerns me. This correction since December 3rd has been too prolonged—it's difficult to interpret it as a single wave cluster.
In one possibility, we might have already entered a new progressive wave (the circled green 1-2-3-4-5). However, it takes on the somewhat exceptional form of a leading expanding diagonal in that case.
If the bullish scenario takes an exceptional shape, let's also consider exceptions for the bearish (correction) scenario. In this case, isn't truncation a possibility? In other words, the high on Christmas might have been the end of the upward wave following a correction that could be WXYXZ as an impulsive wave 4. There are multiple possible ways of counting, but in this case, it's possible to count the high on January 17th as the B of an expanded flat—that is, the B as an irregular top.
Turning our eyes to the weekly chart, the red box clearly functions as a resistance zone, and it appears to have formed a double top. If candlesticks are pushed out from this resistance zone, it would be natural to anticipate movement in a downward direction.
Nevertheless, HBAR holders, including me, will simply accumulate more if the price drops, won't they? Will that opportunity present itself?
Penerbitan berkaitan
Penafian
Maklumat dan penerbitan adalah tidak dimaksudkan untuk menjadi, dan tidak membentuk, nasihat untuk kewangan, pelaburan, perdagangan dan jenis-jenis lain atau cadangan yang dibekalkan atau disahkan oleh TradingView. Baca dengan lebih lanjut di Terma Penggunaan.
Penerbitan berkaitan
Penafian
Maklumat dan penerbitan adalah tidak dimaksudkan untuk menjadi, dan tidak membentuk, nasihat untuk kewangan, pelaburan, perdagangan dan jenis-jenis lain atau cadangan yang dibekalkan atau disahkan oleh TradingView. Baca dengan lebih lanjut di Terma Penggunaan.