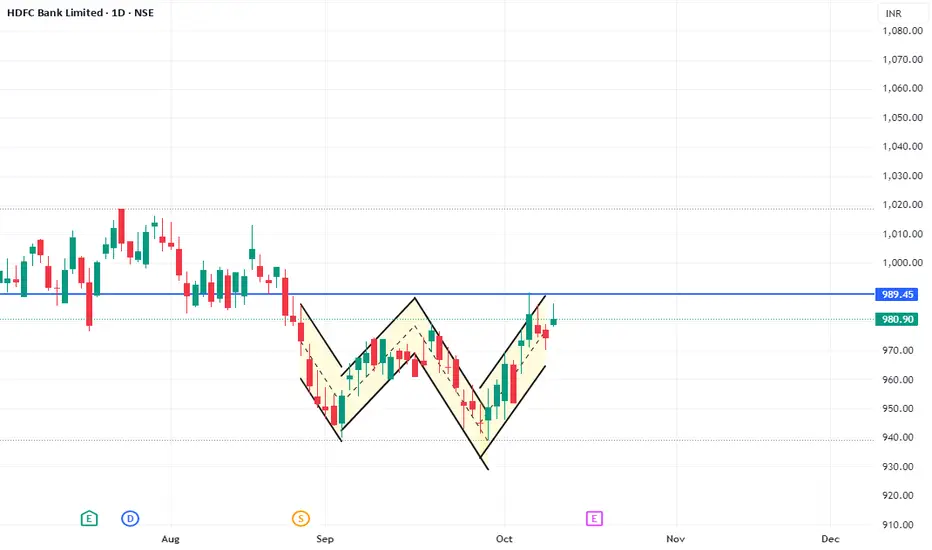
The chart for HDFC Bank Ltd. (HDFCBANK) on the Daily timeframe exhibits a clear "W" formation, which is a classic Double Bottom Reversal Pattern. This pattern suggests that the prior downtrend, which led to the two bottoms, is likely to reverse to an uptrend.
Pattern: Double Bottom / 'W' Pattern.
Timeframe: Daily.
Confirmation Level (Neckline): The crucial confirmation level, or Neckline, is around the ₹989.45 mark (indicated by the blue horizontal line). This is the highest point between the two bottoms.
Market Structure Shift (MSS): A confirmed Market Structure Shift (MSS) to the upside would occur upon a decisive close and sustained breakout above the Neckline of ₹989.45. This breakout would validate the reversal pattern.
Price Action: The price has successfully formed the second trough and has now rallied back up to test the Neckline.
Setup
Bullish Breakout of Double Bottom Pattern
Entry Condition (Long)
A confirmed closing candle (Daily) ABOVE the Neckline at ₹989.45. A re-test of the broken Neckline after the close offers a potentially safer entry.
Confirmation Level (MSS)
₹989.45
Stop Loss (SL)
Place the stop loss below a recent swing low or the midpoint of the last leg up. A good conservative level would be just below the high of the 'M' peak of the second bottom's rise, potentially around ₹975 or a more aggressive placement just under the recent swing low before the neckline challenge.
Target 1 (T1)
The minimum measured move is equal to the distance from the bottoms to the neckline, projected upwards.
Target 1 Calculation
Neckline (₹989.45) - Lowest Bottom (approx. ₹935) = ₹54.45
Target 1 = ₹989.45 + ₹54.45 = ₹1044
Target 2 (T2)
Look towards the previous swing highs around ₹1020 - ₹1030 as an intermediate zone, and then the top of the range before the current pattern started, around ₹1060 for the second target.
Risk Management & Caveats
False Breakout: Wait for a clear daily closing price above ₹989.45. A quick wick above the level that closes below it is a potential trap.
Volume Confirmation: Ideal confirmation should be accompanied by higher-than-average volume during the breakout, signifying strong institutional interest.
Failure: If the price rejects the Neckline severely and breaks below the second bottom's low (around ₹935), the bullish pattern is invalidated, and the downtrend would likely resume.
Dagangan aktif
Trade is active and has hit its first logical target 1019. Still away from my target of 1044 which is "the measured moove" SL should come to cost or book partial profits. Penafian
Maklumat dan penerbitan adalah tidak dimaksudkan untuk menjadi, dan tidak membentuk, nasihat untuk kewangan, pelaburan, perdagangan dan jenis-jenis lain atau cadangan yang dibekalkan atau disahkan oleh TradingView. Baca dengan lebih lanjut di Terma Penggunaan.
Penafian
Maklumat dan penerbitan adalah tidak dimaksudkan untuk menjadi, dan tidak membentuk, nasihat untuk kewangan, pelaburan, perdagangan dan jenis-jenis lain atau cadangan yang dibekalkan atau disahkan oleh TradingView. Baca dengan lebih lanjut di Terma Penggunaan.