Current Price Action
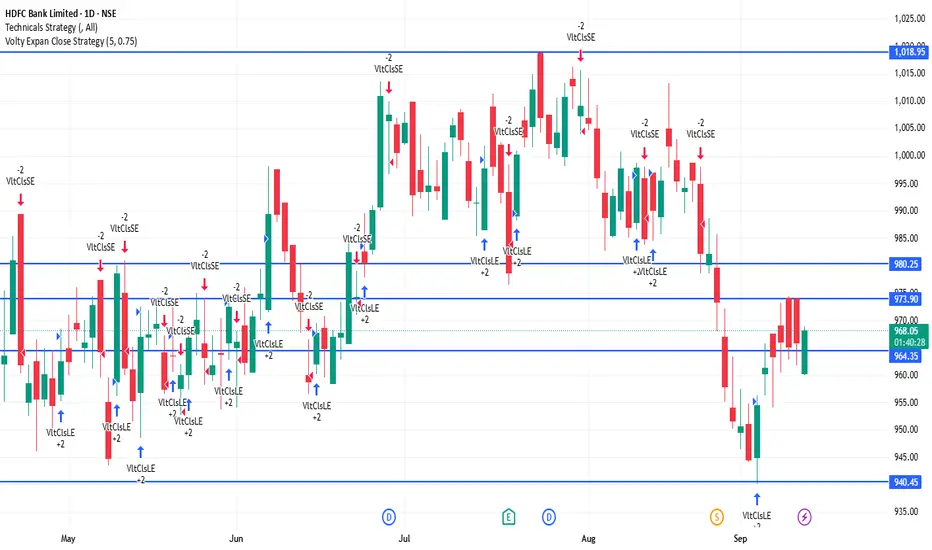
HDFCBANK is trading around ₹962–968.
Day’s low is near ₹960 and high is around ₹978.
The stock is consolidating in a tight range.
⚖️ Key Levels
Immediate Resistance: ₹968 – ₹970
Next Resistance: ₹975 – ₹980
Immediate Support: ₹960
Strong Support: ₹950 – ₹955
📊 Indicators
Moving Averages: Price is below the 50-day MA (short-term weakness) but above the 200-day MA (long-term trend still intact).
RSI (14-day): Around 40–45 → neutral to slightly weak momentum.
MACD: Negative bias, showing limited upside strength.
📈 Outlook
If HDFCBANK stays above ₹960, a bounce toward ₹970 – ₹975 is possible.
A breakout above ₹975 – ₹980 could turn the trend stronger.
If the stock slips below ₹955 – ₹950, it may head lower toward ₹940 – ₹935.
Current bias: Neutral to slightly bearish until price breaks above resistance.
Penerbitan berkaitan
Penafian
Maklumat dan penerbitan adalah tidak dimaksudkan untuk menjadi, dan tidak membentuk, nasihat untuk kewangan, pelaburan, perdagangan dan jenis-jenis lain atau cadangan yang dibekalkan atau disahkan oleh TradingView. Baca dengan lebih lanjut di Terma Penggunaan.
Penerbitan berkaitan
Penafian
Maklumat dan penerbitan adalah tidak dimaksudkan untuk menjadi, dan tidak membentuk, nasihat untuk kewangan, pelaburan, perdagangan dan jenis-jenis lain atau cadangan yang dibekalkan atau disahkan oleh TradingView. Baca dengan lebih lanjut di Terma Penggunaan.