📈 HDFCBANK – Stepping Into Bullish Territory?
🔍 Strong Long Build-Up | Option Chain + Price Action Alignment
Chart Type: 15-min / 1H / Daily
Indicators: STWP Zones, Demand-Supply, Volume, OI Trends
🔹 What’s Catching Our Eye?
✅ Consistent Long Build-Up seen from 2000 CE to 2100 CE
✅ Massive OI Addition on 2040 CE (+6.33 lakh contracts = +50%)
✅ 2060 CE OI jumped +8.57 lakh = +82% – Serious bullish interest building up
✅ Put Writers exiting 2000 PE = Strong base forming around ₹2000
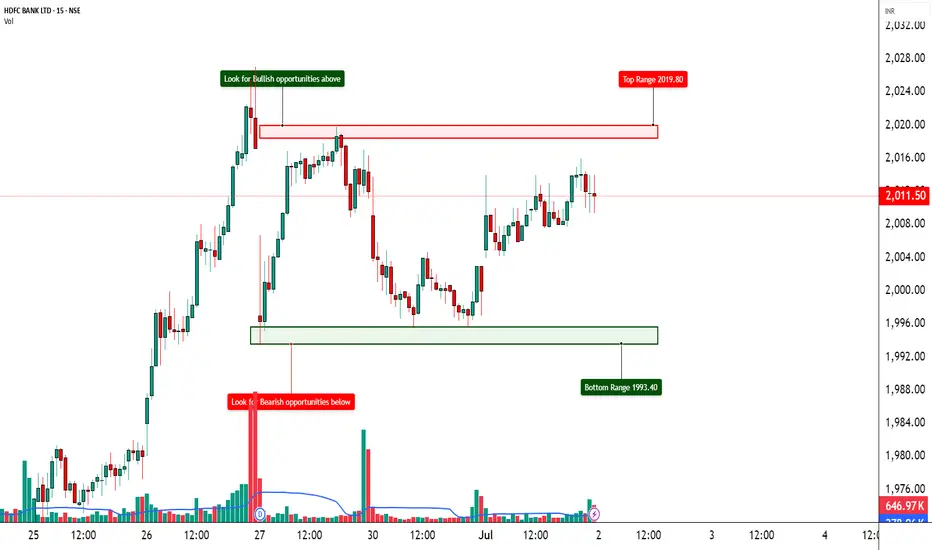
✅ Spot Price at ₹2012, sitting above psychological level
📊 What We’re Watching for:
📍 Breakout Zone: 2020–2040
📍 Targets: 2060 → 2080 → 2100
📍 Invalidation Below: 1985
📍 Momentum Confirmation: Strong close above 2040 with volume surge
📍 Option Chain Support: Heavy unwinding on 2000 PE confirms strength
📌 Trade Plan (Educational Purpose Only):
🔹 Bullish Idea: Buy above 2025 breakout with SL below 1985
🔹 Options: Look at 2040 or 2060 CE for directional exposure
🔹 BTST/Positional: If price closes above 2040 with rising OI and IV
⚠️ Disclaimer:
This post is for educational and learning purposes only.
It does not constitute buy/sell advice or investment recommendation.
Always consult your financial advisor before taking any positions.
STWP is not liable for any financial decisions based on this content.
📚 “Price is the headline, but data is the real story.”
💬 Will HDFCBANK reclaim its momentum zone, or is this just noise before the next move?
🔍 Strong Long Build-Up | Option Chain + Price Action Alignment
Chart Type: 15-min / 1H / Daily
Indicators: STWP Zones, Demand-Supply, Volume, OI Trends
🔹 What’s Catching Our Eye?
✅ Consistent Long Build-Up seen from 2000 CE to 2100 CE
✅ Massive OI Addition on 2040 CE (+6.33 lakh contracts = +50%)
✅ 2060 CE OI jumped +8.57 lakh = +82% – Serious bullish interest building up
✅ Put Writers exiting 2000 PE = Strong base forming around ₹2000
✅ Spot Price at ₹2012, sitting above psychological level
📊 What We’re Watching for:
📍 Breakout Zone: 2020–2040
📍 Targets: 2060 → 2080 → 2100
📍 Invalidation Below: 1985
📍 Momentum Confirmation: Strong close above 2040 with volume surge
📍 Option Chain Support: Heavy unwinding on 2000 PE confirms strength
📌 Trade Plan (Educational Purpose Only):
🔹 Bullish Idea: Buy above 2025 breakout with SL below 1985
🔹 Options: Look at 2040 or 2060 CE for directional exposure
🔹 BTST/Positional: If price closes above 2040 with rising OI and IV
⚠️ Disclaimer:
This post is for educational and learning purposes only.
It does not constitute buy/sell advice or investment recommendation.
Always consult your financial advisor before taking any positions.
STWP is not liable for any financial decisions based on this content.
📚 “Price is the headline, but data is the real story.”
💬 Will HDFCBANK reclaim its momentum zone, or is this just noise before the next move?
Dagangan ditutup secara manual
Invalidated📊 STWP | Mentor | Demand & Supply Specialist
🎯 Helping you become a self-reliant & independent trader
🎓 Learn more: simpletradewithpatience.com
📲 WhatsApp: wa.me/919987567889
🔍 Trade with Clarity. Learn with Patience.
🎯 Helping you become a self-reliant & independent trader
🎓 Learn more: simpletradewithpatience.com
📲 WhatsApp: wa.me/919987567889
🔍 Trade with Clarity. Learn with Patience.
Penafian
Maklumat dan penerbitan adalah tidak dimaksudkan untuk menjadi, dan tidak membentuk, nasihat untuk kewangan, pelaburan, perdagangan dan jenis-jenis lain atau cadangan yang dibekalkan atau disahkan oleh TradingView. Baca dengan lebih lanjut di Terma Penggunaan.
📊 STWP | Mentor | Demand & Supply Specialist
🎯 Helping you become a self-reliant & independent trader
🎓 Learn more: simpletradewithpatience.com
📲 WhatsApp: wa.me/919987567889
🔍 Trade with Clarity. Learn with Patience.
🎯 Helping you become a self-reliant & independent trader
🎓 Learn more: simpletradewithpatience.com
📲 WhatsApp: wa.me/919987567889
🔍 Trade with Clarity. Learn with Patience.
Penafian
Maklumat dan penerbitan adalah tidak dimaksudkan untuk menjadi, dan tidak membentuk, nasihat untuk kewangan, pelaburan, perdagangan dan jenis-jenis lain atau cadangan yang dibekalkan atau disahkan oleh TradingView. Baca dengan lebih lanjut di Terma Penggunaan.