Pattern Overview
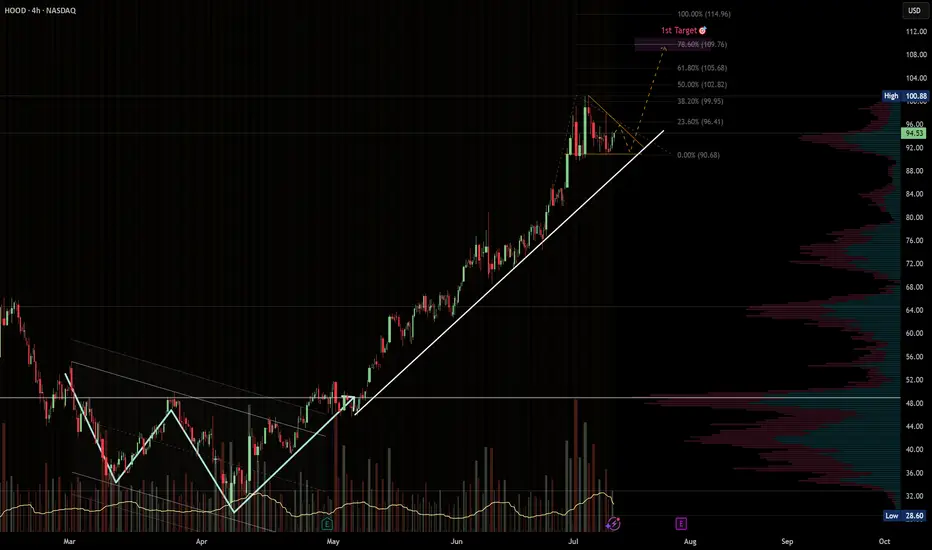
HOOD has been riding a strong ascending trendline since early May, respecting higher highs and higher lows all the way up.
After the most recent parabolic move from ~$90 to ~$101, price is now consolidating in a bullish pennant, just above key fib levels.
The setup looks primed for continuation if we see a breakout above $101 with confirming volume.
---
🎯 Target Zones
🎯 Target Level Why It Matters
Target 1 $109.76 78.6% Fibonacci extension from the previous leg. Common spot for intermediate take-profit. Also matches a soft VPVR resistance area.
Target 2 $114.96 100% measured-move projection of the prior rally. If momentum accelerates, this becomes a realistic stretch zone.
---
🛠️ Trade Plan (Example)
Component Level
Trigger Break and hold above $101 with volume ≥ 20-SMA.
Add-on Opportunity Pullback into $96–97 that respects the rising trendline.
Stop-loss Close < $92.5 invalidates trendline.
TP-1 $109–110 — take partials, move stop to breakeven.
TP-2 $114–115 — full exit or runner trail zone.
---
⚠️ Risk Notes
Watch for false breakouts — confirmation needs volume and price stability above $101.
Earnings or macro news could override technicals. Use tighter stops ahead of event dates.
If trendline fails, next key support sits at $89–90 (previous consolidation base).
---
✅ Trade Checklist
[x] Bullish trendline intact
[x] Continuation pennant forming
[x] Fib & measured move confluence at $109–115
[x] Volume profile supports clean move above $101
[x] Clear invalidation under $92
> Disclaimer: This is not financial advice. Always trade your own plan and manage risk appropriately.
VM
Penafian
Maklumat dan penerbitan adalah tidak dimaksudkan untuk menjadi, dan tidak membentuk, nasihat untuk kewangan, pelaburan, perdagangan dan jenis-jenis lain atau cadangan yang dibekalkan atau disahkan oleh TradingView. Baca dengan lebih lanjut di Terma Penggunaan.
Penafian
Maklumat dan penerbitan adalah tidak dimaksudkan untuk menjadi, dan tidak membentuk, nasihat untuk kewangan, pelaburan, perdagangan dan jenis-jenis lain atau cadangan yang dibekalkan atau disahkan oleh TradingView. Baca dengan lebih lanjut di Terma Penggunaan.