Recently, LTCBTC is getting stronger, which increases the possibility of higher growth.
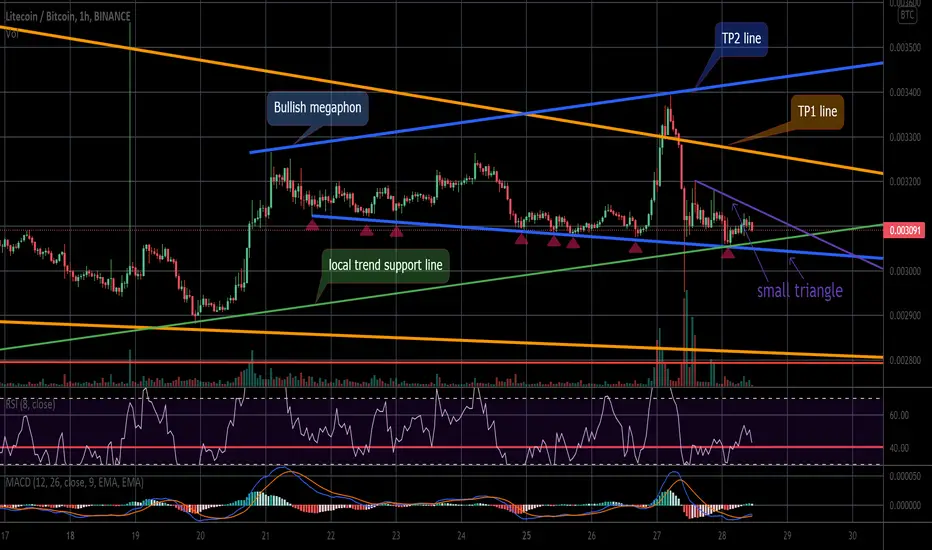
As can be seen on the 1h chart, a small local triangle (blue and violet lines) is formed. A bullish megaphon pattern (blue lines) was also formed.
The price has repeatedly failed to break down the megaphone pattern, which tells us that there will probably be a break up.
If the LTCBTC breaks the triangle upwards (violet line) it will be a long sign.
For a long wait for the violet line to break through:
TP1-orange resistance line.
TP2-blue resistance line
Disclamer: This is not financial advice.
You trade at your own risk.
Penerbitan berkaitan
Penafian
Maklumat dan penerbitan adalah tidak dimaksudkan untuk menjadi, dan tidak membentuk, nasihat untuk kewangan, pelaburan, perdagangan dan jenis-jenis lain atau cadangan yang dibekalkan atau disahkan oleh TradingView. Baca dengan lebih lanjut di Terma Penggunaan.
Penerbitan berkaitan
Penafian
Maklumat dan penerbitan adalah tidak dimaksudkan untuk menjadi, dan tidak membentuk, nasihat untuk kewangan, pelaburan, perdagangan dan jenis-jenis lain atau cadangan yang dibekalkan atau disahkan oleh TradingView. Baca dengan lebih lanjut di Terma Penggunaan.