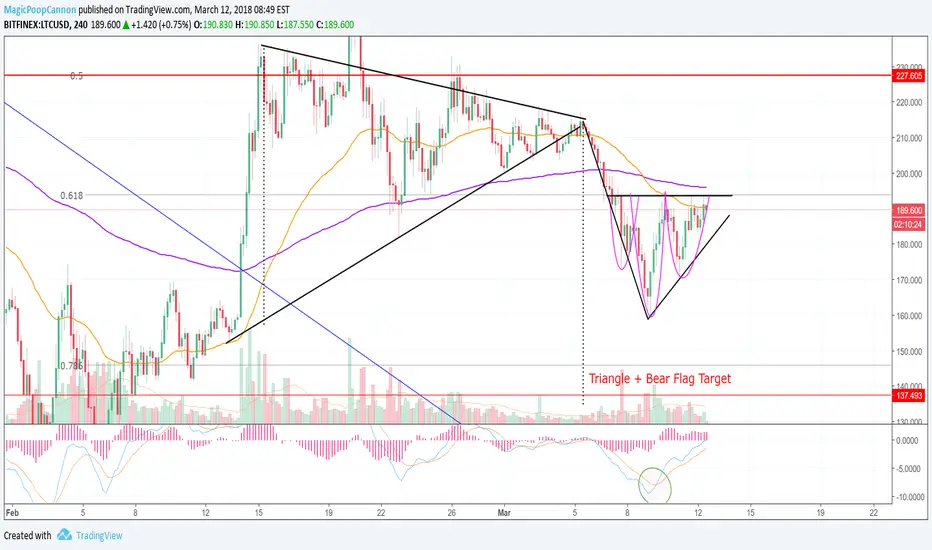
Hi friends! Welcome to this update analysis on Litecoin! Let's get right to it! Looking at the four hour chart, you can see that LTC has morphed into what appears to be a large bear flag. However, the price action inside of the flag itself, has formed an inverse head and shoulders pattern. So, there is a conflict of formations here. Additionally, we can see that the 50 EMA (in orange) is currently acting as repetitive resistance inside of the bear flag. The last candle did close above the 50, but the current candle has reversed back blow it. With that said, plenty of resistance remains overhead. Even if LTC surpasses the 50 EMA, the 61.8% retrace is just above, and the 200 EMA (in purple) is nearly converging with it. With that said, if LTC manages to rally above those levels, we may actually see a strong break to the upside, which could send us back up for a retest of the 50% retrace at the 227.60 level.
In comparison, Bitcoin also formed a bear flag pattern, but it has broken out to the upside, in a move that appears to be negating it as a bear flag. So, based on the performance of BTC, we may see a similar outcome in LTC. That, coupled with the inverse head and shoulders pattern, inside of the bear flag, suggests that an upside breakout is possible. Furthermore, we can see that the MACD is about to cross above the zero line, which is a technical buy signal.
Since there is really a conflict of signals here, and we're getting sustained resistance at the 50 EMA, we can use the 50 EMA to monitor the short term progress of LTC through the flag. You can see that two of the past few candles have pierced the 50 EMA, but they found resistance at the 61.8% retrace, which is just above. So, clearly we have a zone of resistance levels, inside of this bear flag, and that typically increases the likelihood of a breakdown. With that said, if we get above the 200 EMA (in purple) that would clear likely send LTC up to the top of the bear flag. Alternatively, if we see a breakdown of the bear flag, LTC is very likely to fall to the 78.6% retracement, at about 146, and then potentially to the 137.50 level.
I have actually been long since the green candle on the tweezer bottom was formed, on the 9th, in anticipation of a move higher. If we don't see sustained follow through here, and particularly, if we see a breakdown of the bear flag, I will quickly flip, and short LTC to my downside targets. Until then, I will remain in what has become an uncomfortable long position.
***This information is not a recommendation to buy or sell. It is to be used for educational purposes only.***
-Magic loves you-
-JD-
Nota
Update: Given the action of the current candle, it is beginning to seem more likely that we will see a bear flag breakdown. Penafian
Maklumat dan penerbitan adalah tidak dimaksudkan untuk menjadi, dan tidak membentuk, nasihat untuk kewangan, pelaburan, perdagangan dan jenis-jenis lain atau cadangan yang dibekalkan atau disahkan oleh TradingView. Baca dengan lebih lanjut di Terma Penggunaan.
Penafian
Maklumat dan penerbitan adalah tidak dimaksudkan untuk menjadi, dan tidak membentuk, nasihat untuk kewangan, pelaburan, perdagangan dan jenis-jenis lain atau cadangan yang dibekalkan atau disahkan oleh TradingView. Baca dengan lebih lanjut di Terma Penggunaan.