The stock maintains a clear upward trend, with no current negative technical signals. This suggests a high probability of continued price appreciation toward higher target levels.
Detailed Analysis:
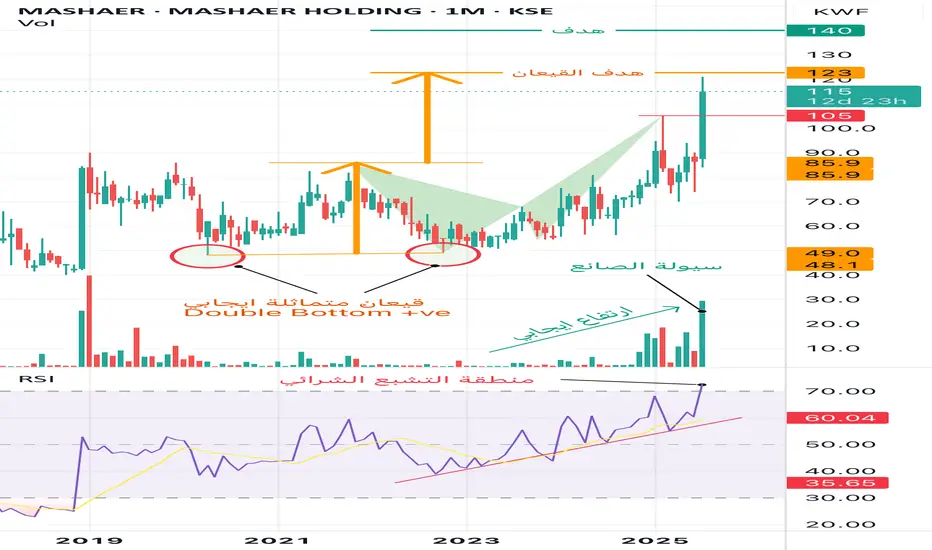
1. Chart Pattern – Double Bottom:
• A positive symmetrical double bottom has been completed, which is one of the strongest bullish reversal patterns.
• The measured target from the pattern (based on the neckline breakout) projects a price level of 123 KWF.
• The current price is 115 KWF, indicating more room for upside.
2. Volume and Liquidity:
• A noticeable surge in trading volume during the latest monthly candle reflects strong institutional inflow.
• This increase is often referred to as “smart money” activity, suggesting accumulation by major players.
3. RSI – Relative Strength Index:
• The RSI has moved into the overbought territory (above 70), signaling that the stock is potentially overextended in the short term.
• However, there are no signs of bearish divergence or a clear reversal signal yet.
• The RSI trend has been consistently rising for several months, supporting the ongoing bullish momentum.
Summary:
The stock remains technically bullish, supported by a valid breakout pattern, rising volume, and strong momentum indicators. Despite the RSI entering overbought levels, the lack of any confirmed reversal signal means the uptrend remains intact.
Price Targets:
• Pattern Target (Double Bottom): 123 KWF
• Strategic Resistance / Long-Term Target: 140 KWF
Detailed Analysis:
1. Chart Pattern – Double Bottom:
• A positive symmetrical double bottom has been completed, which is one of the strongest bullish reversal patterns.
• The measured target from the pattern (based on the neckline breakout) projects a price level of 123 KWF.
• The current price is 115 KWF, indicating more room for upside.
2. Volume and Liquidity:
• A noticeable surge in trading volume during the latest monthly candle reflects strong institutional inflow.
• This increase is often referred to as “smart money” activity, suggesting accumulation by major players.
3. RSI – Relative Strength Index:
• The RSI has moved into the overbought territory (above 70), signaling that the stock is potentially overextended in the short term.
• However, there are no signs of bearish divergence or a clear reversal signal yet.
• The RSI trend has been consistently rising for several months, supporting the ongoing bullish momentum.
Summary:
The stock remains technically bullish, supported by a valid breakout pattern, rising volume, and strong momentum indicators. Despite the RSI entering overbought levels, the lack of any confirmed reversal signal means the uptrend remains intact.
Price Targets:
• Pattern Target (Double Bottom): 123 KWF
• Strategic Resistance / Long-Term Target: 140 KWF
Penafian
Maklumat dan penerbitan adalah tidak dimaksudkan untuk menjadi, dan tidak membentuk, nasihat untuk kewangan, pelaburan, perdagangan dan jenis-jenis lain atau cadangan yang dibekalkan atau disahkan oleh TradingView. Baca dengan lebih lanjut di Terma Penggunaan.
Penafian
Maklumat dan penerbitan adalah tidak dimaksudkan untuk menjadi, dan tidak membentuk, nasihat untuk kewangan, pelaburan, perdagangan dan jenis-jenis lain atau cadangan yang dibekalkan atau disahkan oleh TradingView. Baca dengan lebih lanjut di Terma Penggunaan.