Price Action Analysis:
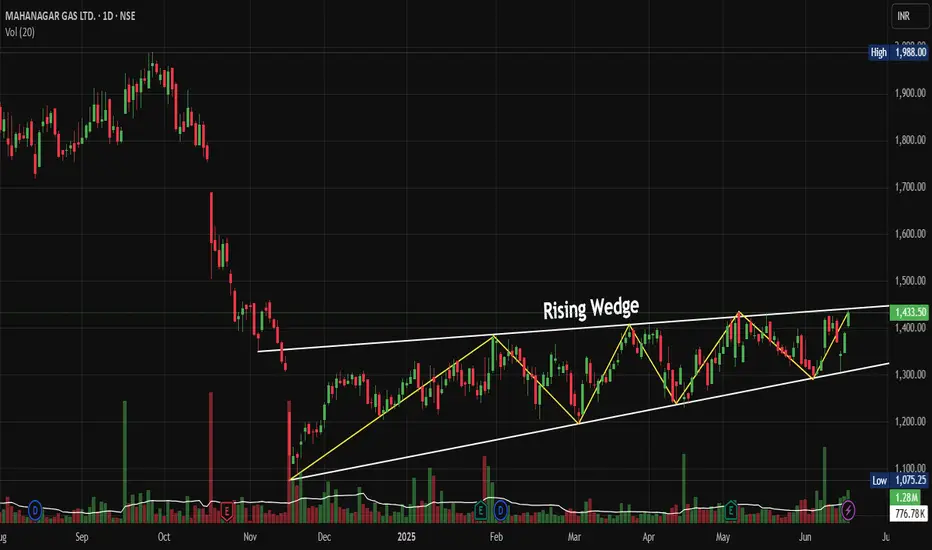
• Stock has formed a classic Rising Wedge pattern from November 2024 lows around 1,075 to current levels near 1,433
• The wedge shows converging trendlines with higher highs and higher lows, typical of consolidation before a breakout
• Recent breakout above the upper trendline around 1,400 levels confirms bullish momentum
• Price has rallied 33% from the wedge base, indicating strong underlying demand
Volume Spread Analysis:
• Volume spikes are visible during key breakout moments, particularly in recent sessions
• Higher volume on up days compared to down days suggests institutional accumulation
• Volume expansion during the wedge breakout confirms genuine buying interest
• Recent green volume bars indicate sustained buying pressure supporting the uptrend
Key Technical Levels:
Support Levels:
• Immediate support at 1,380-1,400 (previous resistance turned support)
• Secondary support at 1,300 (middle of the rising wedge)
• Major support at 1,200-1,250 (lower trendline of the wedge)
• Critical support at 1,075 (November 2024 lows)
Resistance Levels:
• Immediate resistance at 1,450-1,470 (psychological levels)
• Next resistance at 1,500 (round number resistance)
• Extended target at 1,600-1,650 based on wedge height projection
• 52-Week high resistance around 1,988 (historical peak)
Technical Patterns:
• Rising Wedge pattern near to completion with successful breakout
• Multiple higher highs and higher lows confirming uptrend structure
• Potential cup and handle formation on longer timeframes
• Bullish flag consolidation patterns within the broader uptrend
Trade Setup:
Entry Strategy:
• Primary entry on pullback to 1,400-1,420 levels (retest of breakout zone)
• Aggressive entry at the current market price of around 1,433 for momentum players
• Scale-in approach: 50% at 1,420, 25% at 1,380, 25% at 1,350
Exit Levels:
• First target: 1,500 (16% upside from current levels)
• Second target: 1,600 (22% upside potential)
• Extended target: 1,700-1,750 for long-term holders
• Trailing stop-loss strategy recommended above 1,500 levels
Stop-Loss Placement:
• Conservative stop-loss: 1,320 (below wedge support)
• Aggressive stop-loss: 1,380 (below immediate support)
• Risk-reward ratio of 1:2 to 1:3 depending on entry and exit points
Position Sizing and Risk Management:
• Allocate a maximum of 2-3% of the portfolio to a single position
• Use a 1% risk per trade rule based on stop-loss distance
• Consider partial profit booking at 1,500 levels
• Maintain position size discipline to avoid overexposure
Sectoral and Fundamental Backdrop:
Sector Analysis:
• City Gas Distribution (CGD) sector showing resilience amid energy transition
• The government push for clean fuel adoption, supporting the natural gas demand
• Infrastructure expansion in tier-2 and tier-3 cities benefiting CGD companies
• Regulatory environment remains supportive with steady tariff mechanisms
Fundamental Strengths:
•
• Strong cash flows from residential and industrial customer base
• Consistent dividend-paying track record with healthy payout ratios
• Robust balance sheet with minimal debt and strong return on equity
• Expanding PNG and CNG network, providing growth visibility
Key Catalysts:
• Increasing vehicle conversion to CNG, supporting volume growth
• Industrial demand recovery post-pandemic is driving commercial sales
• Government policies favouring cleaner fuel alternatives
• Potential for geographical expansion into new license areas
Risk Factors:
• Crude oil price volatility is affecting input costs
• Competition from electric vehicles in the transportation segment
• Regulatory changes in gas pricing mechanisms
• Economic slowdown impacting industrial demand
My Take:
The technical setup suggests
Keep in the Watchlist.
NO RECO. For Buy/Sell.
📌Thank you for exploring my idea! I hope you found it valuable.
🙏FOLLOW for more
👍BOOST if you found it useful.
✍️COMMENT below with your views.
Meanwhile, check out my other stock ideas on the right side until this trade is activated. I would love your feedback.
Disclaimer: "I am not a SEBI REGISTERED RESEARCH ANALYST AND INVESTMENT ADVISER."
This analysis is intended solely for informational and educational purposes and should not be interpreted as financial advice. It is advisable to consult a qualified financial advisor or conduct thorough research before making investment decisions.
Penerbitan berkaitan
Penafian
Maklumat dan penerbitan adalah tidak bertujuan, dan tidak membentuk, nasihat atau cadangan kewangan, pelaburan, dagangan atau jenis lain yang diberikan atau disahkan oleh TradingView. Baca lebih dalam Terma Penggunaan.
Penerbitan berkaitan
Penafian
Maklumat dan penerbitan adalah tidak bertujuan, dan tidak membentuk, nasihat atau cadangan kewangan, pelaburan, dagangan atau jenis lain yang diberikan atau disahkan oleh TradingView. Baca lebih dalam Terma Penggunaan.