Overview:
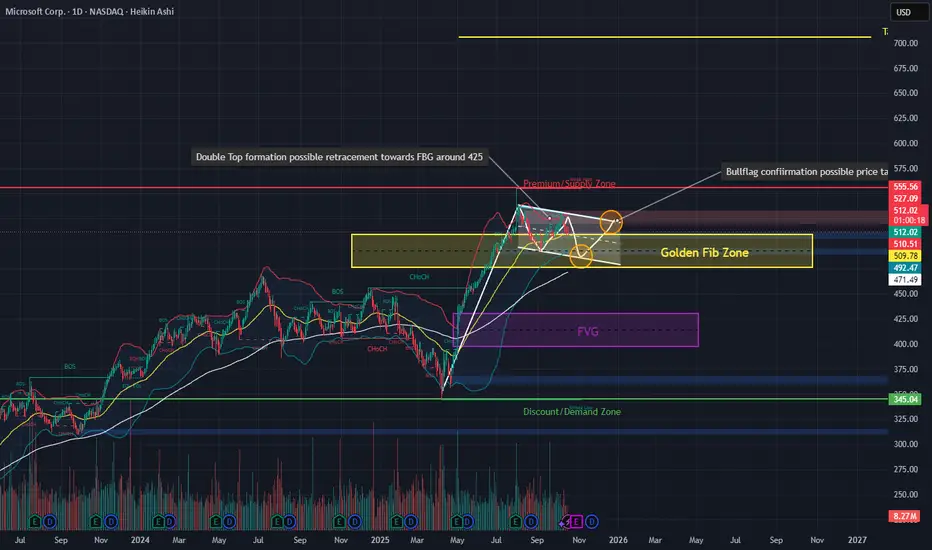
Current structure shows confluence between a double-top formation near recent highs and a potential bull flag retracement setup. Price is consolidating around the $505–$510 zone, which overlaps with the 50 EMA and a mid-range supply area.
Pattern Outlook
Double-Top Possibility:
Price has rejected from prior highs, forming symmetry around a weak-high zone. A confirmed break below the $492–$495 zone would validate the double-top and suggest a retracement toward the FVG zone around $425.
Bull Flag Scenario:
If price maintains structure within the flag channel and finds demand in the yellow box ($490–$500 area), a bounce toward new ATH are on the table.
Confluences & Indicators
Volume: Still elevated compared to the previous down-move → supports continuation potential.
MACD: Currently flattening with early crossover hints; momentum could shift quickly.
RSI: Neutral (~55), leaving room for either direction.
Bollinger Bands: Tightening — volatility expansion incoming.
Macro & Catalyst 📰
🏢 $40B Data Center Acquisition:
Microsoft and investors securing computing infrastructure for AI expansion → long-term bullish catalyst. It signals aggressive reinforcement of their cloud and AI training capacity, directly supporting Azure and OpenAI workloads.
🕵️ Cybersecurity Breach (Chinese hackers exploiting SharePoint):
Short-term bearish risk factor, especially if it affects government confidence and triggers regulatory scrutiny. Expect possible volatility or temporary pullbacks while markets price the risk.
💻 Partnership with Nscale + Nvidia (200,000 GB300 GPUs):
Reinforces AI dominance narrative and resource moat through 2029, acting as a strong bullish fundamental. Also fuels investor sentiment around AI infrastructure spending.
🤝 Expansion with Cyviz:
Focus on visualization and collaboration tools enhances Microsoft’s ecosystem stickiness — secondary but still supportive for long-term value.
Macro Takeaway:
Even if a technical retracement occurs, the fundamentals remain extremely bullish into 2026. The $425–$435 zone could become a prime accumulation level if institutions buy the dip based on these AI catalysts.
Conclusion:
Microsoft’s chart and fundamentals are aligned for a macro bullish continuation following any near-term correction. Traders should monitor the $490 support closely for continuation confirmation and keep the FVG zone ($425–$435) on watch for a potential institutional re-entry opportunity.
Penafian
Maklumat dan penerbitan adalah tidak dimaksudkan untuk menjadi, dan tidak membentuk, nasihat untuk kewangan, pelaburan, perdagangan dan jenis-jenis lain atau cadangan yang dibekalkan atau disahkan oleh TradingView. Baca dengan lebih lanjut di Terma Penggunaan.
Penafian
Maklumat dan penerbitan adalah tidak dimaksudkan untuk menjadi, dan tidak membentuk, nasihat untuk kewangan, pelaburan, perdagangan dan jenis-jenis lain atau cadangan yang dibekalkan atau disahkan oleh TradingView. Baca dengan lebih lanjut di Terma Penggunaan.