Eyeing $531 Breakout 🚀
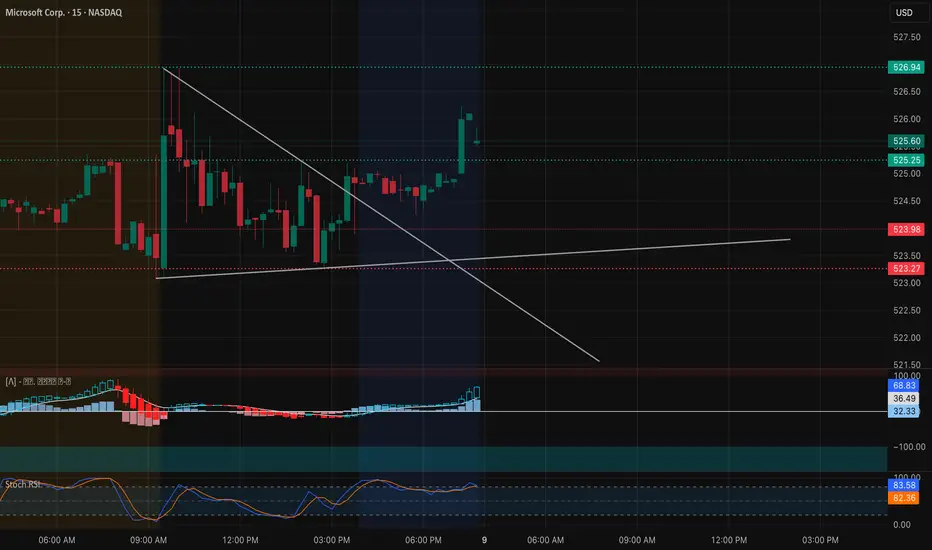
Microsoft (MSFT) is showing a strong bullish reversal after clearing its descending trendline on the 15-minute chart. Price reclaimed $525 support with a solid impulsive candle, confirming a short-term CHoCH followed by upward momentum. The breakout from the compression zone has opened room toward $528–$531 resistance.
MACD flipped bullish with increasing histogram bars, while Stoch RSI remains elevated but not yet signaling exhaustion. As long as $523 holds, momentum favors continued upside into the next gamma resistance zone.
On the 1-hour chart, MSFT is trading between $517.5 (HVL support) and $531 (gamma resistance) — a clean range that aligns with its recent breakout structure. Volume confirms accumulation near $522–$525, reinforcing the bullish bias for continuation.
Support and Resistance Levels:
* Immediate Resistance: $526.9 → $528
* Major Resistance (Gamma Wall): $531 → $535
* Immediate Support: $523.9 → $523.2
* Key Support Zone: $517.5 → $511
GEX & Options Sentiment (1H GEX Chart):

* The highest positive Call Gamma sits near $531, forming the next magnet if momentum continues.
* Strong Put Support lies around $505–$500, providing a solid floor for bulls.
* IVR 33.2 and Call sentiment 11.8% suggest room for fresh upside exposure — a potential gamma squeeze if MSFT breaks $528.
* The GEX curve steepens positively above $525, supporting price expansion once breakout volume sustains.
Trade Scenarios:
Bullish Setup:
* Entry: Above $526 breakout
* Target 1: $528
* Target 2: $531
* Stop-Loss: Below $523
* Rationale: Clear trendline break, bullish MACD momentum, and supportive GEX profile indicate strong continuation potential.
Bearish Setup:
* Entry: Below $523 breakdown
* Target 1: $517.5
* Target 2: $511
* Stop-Loss: Above $526
* Rationale: Rejection at $526.9 could trigger a pullback toward the HVL range before rebounding.
MSFT has regained strength with clear bullish intent above $525. Watch for volume confirmation above $526 for the next leg toward $531. As long as price stays above $523, bulls remain firmly in control.
Disclaimer: This analysis is for educational purposes only and does not constitute financial advice. Always do your own research and manage your risk before trading.
If anyone needs me to TA any stock, PM me.
Microsoft (MSFT) is showing a strong bullish reversal after clearing its descending trendline on the 15-minute chart. Price reclaimed $525 support with a solid impulsive candle, confirming a short-term CHoCH followed by upward momentum. The breakout from the compression zone has opened room toward $528–$531 resistance.
MACD flipped bullish with increasing histogram bars, while Stoch RSI remains elevated but not yet signaling exhaustion. As long as $523 holds, momentum favors continued upside into the next gamma resistance zone.
On the 1-hour chart, MSFT is trading between $517.5 (HVL support) and $531 (gamma resistance) — a clean range that aligns with its recent breakout structure. Volume confirms accumulation near $522–$525, reinforcing the bullish bias for continuation.
Support and Resistance Levels:
* Immediate Resistance: $526.9 → $528
* Major Resistance (Gamma Wall): $531 → $535
* Immediate Support: $523.9 → $523.2
* Key Support Zone: $517.5 → $511
GEX & Options Sentiment (1H GEX Chart):
* The highest positive Call Gamma sits near $531, forming the next magnet if momentum continues.
* Strong Put Support lies around $505–$500, providing a solid floor for bulls.
* IVR 33.2 and Call sentiment 11.8% suggest room for fresh upside exposure — a potential gamma squeeze if MSFT breaks $528.
* The GEX curve steepens positively above $525, supporting price expansion once breakout volume sustains.
Trade Scenarios:
Bullish Setup:
* Entry: Above $526 breakout
* Target 1: $528
* Target 2: $531
* Stop-Loss: Below $523
* Rationale: Clear trendline break, bullish MACD momentum, and supportive GEX profile indicate strong continuation potential.
Bearish Setup:
* Entry: Below $523 breakdown
* Target 1: $517.5
* Target 2: $511
* Stop-Loss: Above $526
* Rationale: Rejection at $526.9 could trigger a pullback toward the HVL range before rebounding.
MSFT has regained strength with clear bullish intent above $525. Watch for volume confirmation above $526 for the next leg toward $531. As long as price stays above $523, bulls remain firmly in control.
Disclaimer: This analysis is for educational purposes only and does not constitute financial advice. Always do your own research and manage your risk before trading.
If anyone needs me to TA any stock, PM me.
Penafian
Maklumat dan penerbitan adalah tidak dimaksudkan untuk menjadi, dan tidak membentuk, nasihat untuk kewangan, pelaburan, perdagangan dan jenis-jenis lain atau cadangan yang dibekalkan atau disahkan oleh TradingView. Baca dengan lebih lanjut di Terma Penggunaan.
Penafian
Maklumat dan penerbitan adalah tidak dimaksudkan untuk menjadi, dan tidak membentuk, nasihat untuk kewangan, pelaburan, perdagangan dan jenis-jenis lain atau cadangan yang dibekalkan atau disahkan oleh TradingView. Baca dengan lebih lanjut di Terma Penggunaan.