Last week I posted a weekly chart (linked below) to note that this is a stock to watch because of the doji candle. Though price opened higher, I am skeptical of more upside for a few reasons:
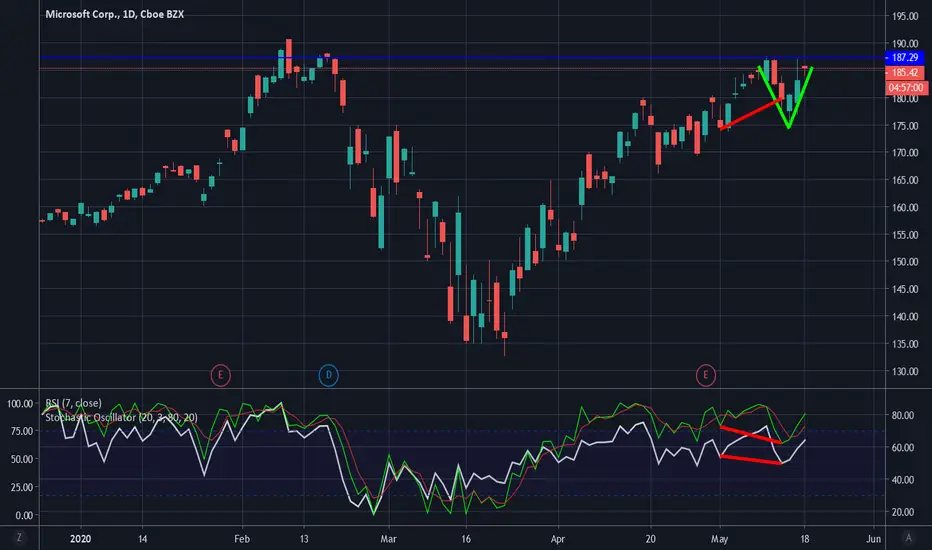
1- large "V" complete, see blue resistance line, though stock could go up to 188-190
2- stochastic (20day) and RSI (7-day) diverge from higher low price action (see 3 red lines) - on my chart I use 7 and 14 day RSI because I find in strong trends the 7day is more useful
3- I see two bearish signs in green "V" - there is a bearish engulfing candle on May 12 and on May 15 selling occurred in the same area (wick on green candle)
I bought puts for a swing trade and will be looking at lower timeframes. I want to see if today closes above or below weekly "V" close of 185.35
Penerbitan berkaitan
Penafian
Maklumat dan penerbitan adalah tidak dimaksudkan untuk menjadi, dan tidak membentuk, nasihat untuk kewangan, pelaburan, perdagangan dan jenis-jenis lain atau cadangan yang dibekalkan atau disahkan oleh TradingView. Baca dengan lebih lanjut di Terma Penggunaan.
Penerbitan berkaitan
Penafian
Maklumat dan penerbitan adalah tidak dimaksudkan untuk menjadi, dan tidak membentuk, nasihat untuk kewangan, pelaburan, perdagangan dan jenis-jenis lain atau cadangan yang dibekalkan atau disahkan oleh TradingView. Baca dengan lebih lanjut di Terma Penggunaan.