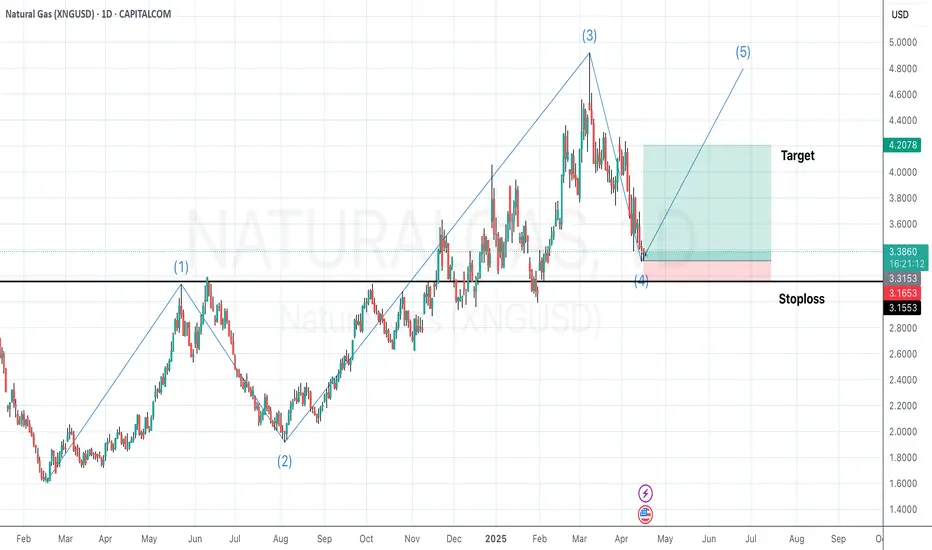
We are observing a classic Elliott Wave structure unfolding on the Daily timeframe of Natural Gas (XNGUSD). Here's a breakdown of the current wave count:
Wave (1) started the initial impulse move up breaking the previous downtrend.
Wave (2) retraced sharply but respected the Fibonacci support zone.
Wave (3) extended significantly, following typical wave dynamics.
Wave (4) appears to have completed near a key support zone, aligning with previous structure and a possible Fibonacci retracement level.
🔹 We are now potentially entering Wave (5) — a final impulse leg to the upside in this cycle.
🔹 Entry is anticipated at the completion of Wave (4), with targets projected near the previous swing highs.
🔹 A stop-loss is marked just below the Wave (4) support zone to manage risk effectively.
This setup offers a favorable risk-to-reward ratio, especially if price continues to respect the Elliott Wave pattern.
📌 Disclaimer:
This analysis is shared purely for educational and study purposes. It does not constitute financial advice or a trading recommendation. Please do your own research and consult a financial advisor before making any trading decisions.
Nota
Target achieved.Penafian
Maklumat dan penerbitan adalah tidak dimaksudkan untuk menjadi, dan tidak membentuk, nasihat untuk kewangan, pelaburan, perdagangan dan jenis-jenis lain atau cadangan yang dibekalkan atau disahkan oleh TradingView. Baca dengan lebih lanjut di Terma Penggunaan.
Penafian
Maklumat dan penerbitan adalah tidak dimaksudkan untuk menjadi, dan tidak membentuk, nasihat untuk kewangan, pelaburan, perdagangan dan jenis-jenis lain atau cadangan yang dibekalkan atau disahkan oleh TradingView. Baca dengan lebih lanjut di Terma Penggunaan.