Technical Analysis Summary:
1. Pattern Breakdown:
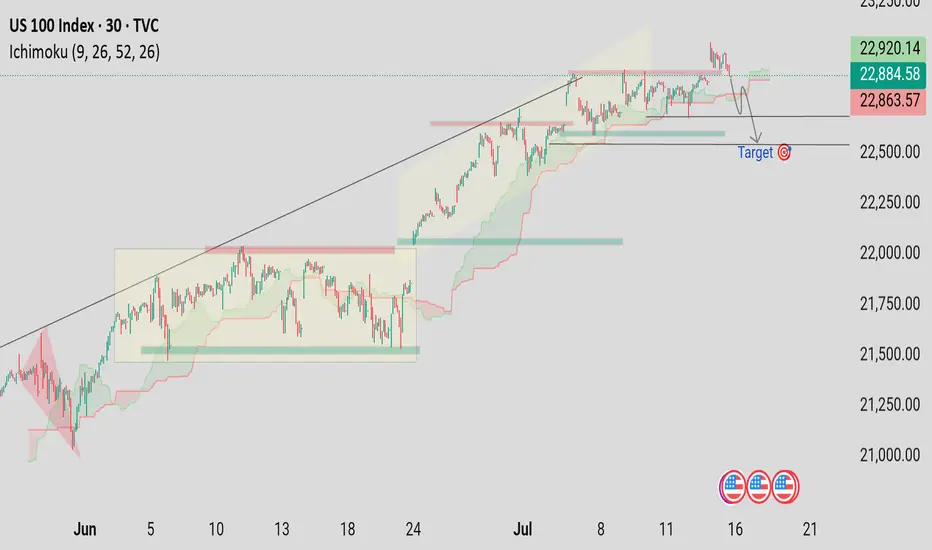
Price has broken below an ascending trendline, signaling weakness after a strong bullish move.
A double-top or distribution phase can be inferred at the recent highs (around 23,100–23,200), confirming buyer exhaustion.
2. Ichimoku Cloud:
The price has dipped into the Ichimoku cloud, indicating indecision or early bearishness.
If it breaks below the cloud, it would confirm a bearish trend continuation.
3. Key Levels:
Resistance: Around 22,920 – 23,200 (recent highs)
Support: Multiple levels observed, but the major target is marked near 22,400.
This aligns with a prior consolidation zone, making it a likely demand area.
4. Price Action:
The projected path (gray line) suggests a potential retest of broken support, followed by a drop toward the 22,400 target.
Current price at 22,884 still offers room to the downside.
5. Volume/Events:
Economic events icons at the bottom (likely U.S. economic news releases) may trigger volatility and either confirm or reject this bearish setup.
---
🔍 Conclusion:
Bias: Bearish short-term
Target: 22,400
Invalidation: A strong move back above 23,000 with bullish momentum
Strategy Suggestion: Watch for a break and close below the Ichimoku cloud, or a lower high rejection for a short entry confirmation.
1. Pattern Breakdown:
Price has broken below an ascending trendline, signaling weakness after a strong bullish move.
A double-top or distribution phase can be inferred at the recent highs (around 23,100–23,200), confirming buyer exhaustion.
2. Ichimoku Cloud:
The price has dipped into the Ichimoku cloud, indicating indecision or early bearishness.
If it breaks below the cloud, it would confirm a bearish trend continuation.
3. Key Levels:
Resistance: Around 22,920 – 23,200 (recent highs)
Support: Multiple levels observed, but the major target is marked near 22,400.
This aligns with a prior consolidation zone, making it a likely demand area.
4. Price Action:
The projected path (gray line) suggests a potential retest of broken support, followed by a drop toward the 22,400 target.
Current price at 22,884 still offers room to the downside.
5. Volume/Events:
Economic events icons at the bottom (likely U.S. economic news releases) may trigger volatility and either confirm or reject this bearish setup.
---
🔍 Conclusion:
Bias: Bearish short-term
Target: 22,400
Invalidation: A strong move back above 23,000 with bullish momentum
Strategy Suggestion: Watch for a break and close below the Ichimoku cloud, or a lower high rejection for a short entry confirmation.
Penafian
Maklumat dan penerbitan adalah tidak dimaksudkan untuk menjadi, dan tidak membentuk, nasihat untuk kewangan, pelaburan, perdagangan dan jenis-jenis lain atau cadangan yang dibekalkan atau disahkan oleh TradingView. Baca dengan lebih lanjut di Terma Penggunaan.
Penafian
Maklumat dan penerbitan adalah tidak dimaksudkan untuk menjadi, dan tidak membentuk, nasihat untuk kewangan, pelaburan, perdagangan dan jenis-jenis lain atau cadangan yang dibekalkan atau disahkan oleh TradingView. Baca dengan lebih lanjut di Terma Penggunaan.