Some have asked about NEO and to provide an update. Fortunately it is relatively easy as I keep notes on all my holdings in chart form. Attached is the cleaned up version. You should also have notes and charts saved for your core coins so you are not recreating the wheel every time, it also improves your TA when you can go back and see what you were thinking and the subsequent outcome. This is critical for learning to read trends and perfect your technique. So I have clarified a few things for this article, but the trends are quite clear, and as one would expect we are right where we should be regardless of the news in China!!
But what about China, it had to have an affect right? Well if you believe China was the reason for the selloff, then what caused the bull trap that same week? Trends, EW and Fibb provided the guidance long before we got there. Notice the correction ended right where the down trend and long term trend intersected. Right at the .786 fibb retracement and into wave 4 as we would have expected from EW and Fibb? Failure to realize this was way overbought and was following almost an identical formation as we saw in wave 3 where it pulled back to the .786 level is denying markets cycle and trends always gravitate back to the mean. Especially seeing the swings in BTC and ETH as of late, NEO has been rather, well, channeled. These pullbacks have little to do with news, and everything to do with market cycles, trends, and sentiment. The faster you'll learn how to identify these cycles and trends, the quicker you will profit from them. Still don't believe? Well then what caused the selloff in wave 4 that corrected .786? News from Argentina?
Ok on to the chart.
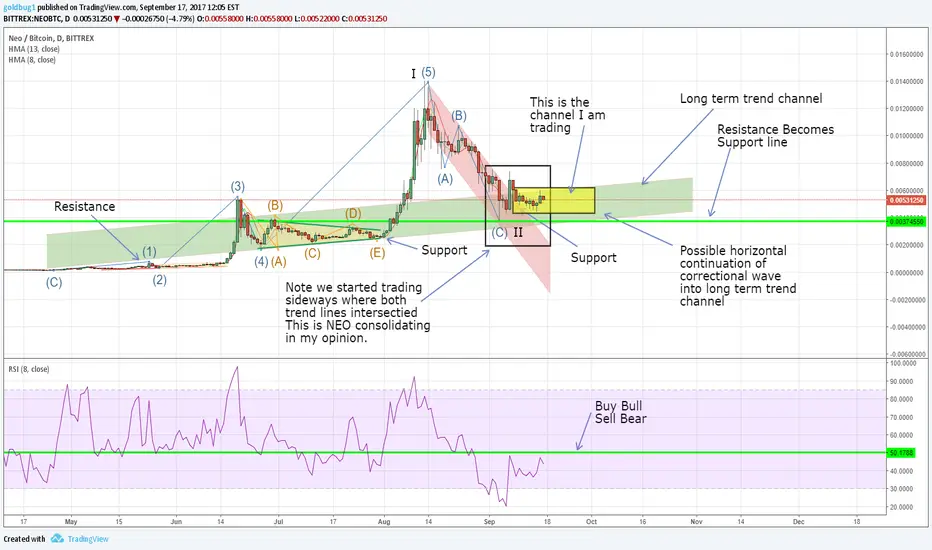
If you look at the chart, wave 5 is very much extended and hence the correction is as expected, into the level of wave 4 at the .786 fibb retracement . This is very typical for a parabolic run.
The base of wave 5 (ABCDE) corrective pattern provided a nice positive trend channel (green), which when extended, was resistance at the end of wave 1 and should be supportive during a correction. I also show the negative trend channel from the correction from wave 5 (red). You can see clearly where these intersected, and this would most likely form a level of resistance and support. Well after C we got our bounce, on the news that Trump was elected right? LOL just had to say it. But it is a typical bull trap or dead cat bounce. Are you starting to see a pattern? It's a little lower than expected but not out of line with other coins that also corrected to the .786 level.
We have now continued sideways in the upper half of our original trend formed during the beginning of wave 5. This is a full correction in my opinion and I don't see a further one from here, but you must keep in mind the market goes by it's own rules not ours. To me this is a signal that this is still a bullish coin, but we cannot trade until we know for sure.
Hence my consolidation box. Currently I am trading the box (but that is another blog). What I can tell you is if it breaks to the upside and supports or I have a secondary signal the bull is breaking out, I will add to my position. In the event it breaks the lower channel where I have the green line drawn is where I will actually sell some of or even all of the core as this may be a signal something fundamentally is breaking down. NEO is not as far advanced as the likes of ETH, but it has the potential to be a $300 coin like etherium, only time will tell, but in the meantime we have a plan. If you have read previous posts I have detailed how and what I use the RSI for, so if you haven't read it, then I might suggest reading it.
But what about China, it had to have an affect right? Well if you believe China was the reason for the selloff, then what caused the bull trap that same week? Trends, EW and Fibb provided the guidance long before we got there. Notice the correction ended right where the down trend and long term trend intersected. Right at the .786 fibb retracement and into wave 4 as we would have expected from EW and Fibb? Failure to realize this was way overbought and was following almost an identical formation as we saw in wave 3 where it pulled back to the .786 level is denying markets cycle and trends always gravitate back to the mean. Especially seeing the swings in BTC and ETH as of late, NEO has been rather, well, channeled. These pullbacks have little to do with news, and everything to do with market cycles, trends, and sentiment. The faster you'll learn how to identify these cycles and trends, the quicker you will profit from them. Still don't believe? Well then what caused the selloff in wave 4 that corrected .786? News from Argentina?
Ok on to the chart.
If you look at the chart, wave 5 is very much extended and hence the correction is as expected, into the level of wave 4 at the .786 fibb retracement . This is very typical for a parabolic run.
The base of wave 5 (ABCDE) corrective pattern provided a nice positive trend channel (green), which when extended, was resistance at the end of wave 1 and should be supportive during a correction. I also show the negative trend channel from the correction from wave 5 (red). You can see clearly where these intersected, and this would most likely form a level of resistance and support. Well after C we got our bounce, on the news that Trump was elected right? LOL just had to say it. But it is a typical bull trap or dead cat bounce. Are you starting to see a pattern? It's a little lower than expected but not out of line with other coins that also corrected to the .786 level.
We have now continued sideways in the upper half of our original trend formed during the beginning of wave 5. This is a full correction in my opinion and I don't see a further one from here, but you must keep in mind the market goes by it's own rules not ours. To me this is a signal that this is still a bullish coin, but we cannot trade until we know for sure.
Hence my consolidation box. Currently I am trading the box (but that is another blog). What I can tell you is if it breaks to the upside and supports or I have a secondary signal the bull is breaking out, I will add to my position. In the event it breaks the lower channel where I have the green line drawn is where I will actually sell some of or even all of the core as this may be a signal something fundamentally is breaking down. NEO is not as far advanced as the likes of ETH, but it has the potential to be a $300 coin like etherium, only time will tell, but in the meantime we have a plan. If you have read previous posts I have detailed how and what I use the RSI for, so if you haven't read it, then I might suggest reading it.
Penafian
Maklumat dan penerbitan adalah tidak dimaksudkan untuk menjadi, dan tidak membentuk, nasihat untuk kewangan, pelaburan, perdagangan dan jenis-jenis lain atau cadangan yang dibekalkan atau disahkan oleh TradingView. Baca dengan lebih lanjut di Terma Penggunaan.
Penafian
Maklumat dan penerbitan adalah tidak dimaksudkan untuk menjadi, dan tidak membentuk, nasihat untuk kewangan, pelaburan, perdagangan dan jenis-jenis lain atau cadangan yang dibekalkan atau disahkan oleh TradingView. Baca dengan lebih lanjut di Terma Penggunaan.