Netflix (NFLX) Shares See a Sharp Decline
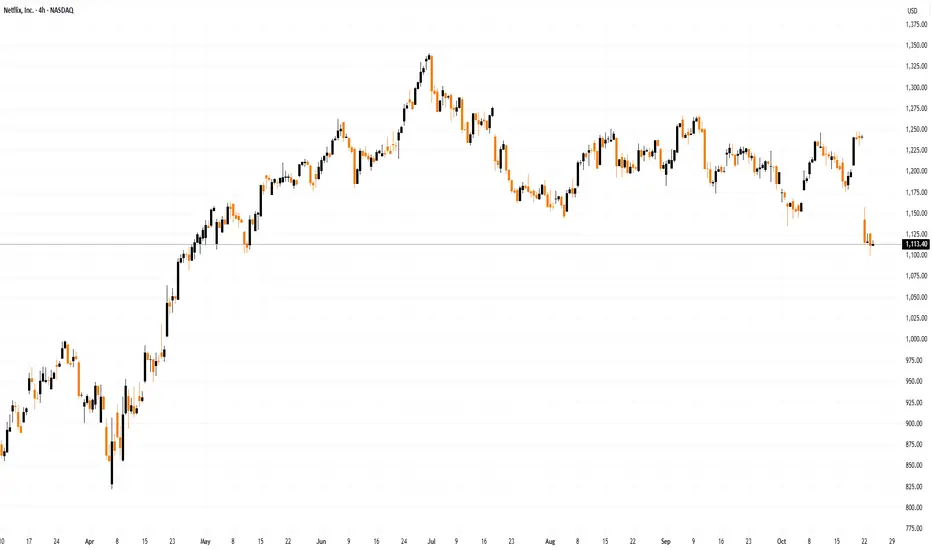
According to recent charts, Netflix (NFLX) shares have traded below $1,100 this week — for the first time since late May. The stock has fallen more than 17% from its July peak, while the S&P 500 index remains close to record highs.
Why Has Netflix (NFLX) Fallen?
The main catalyst for the drop was the company’s earnings report, which showed results well below expectations: actual EPS came in at $5.87 versus a forecast of $6.96 and a previous reading of $7.19.
Despite the success of several new releases, the figures were weighed down by a tax dispute in Brazil, which significantly dampened market sentiment. Nevertheless, the bulls still have reasons for cautious optimism.

Technical Analysis of the NFLX Chart
The NFLX share price remains within a long-term upward channel (marked in blue). It has now approached a key support zone formed by:
→ the lower boundary of the main channel, which previously provided support in April;
→ the lower line of a short-term downward trajectory (marked in red);
→ the psychological level of $1,100.
Bulls are taking encouragement from the fact that:
→ the RSI indicator has entered oversold territory;
→ the price previously moved confidently through the $1,000–$1,100 range, suggesting that strong buying interest may still persist in this area.
From the sellers’ perspective, however, attention should be paid to the large bearish gap formed earlier this week, with its lower edge near $1,100, which could now act as resistance.
Taking all this into account, it seems reasonable to assume that:
→ the current support zone may prevent further declines in NFLX shares;
→ the impact of the Brazilian tax case (reported losses of around $600 million) may already be priced in;
→ bulls could attempt to resume the broader uptrend, potentially turning the red trajectory into a bullish flag pattern.
On the other hand, failure to hold within the blue channel would expose the $1,000 level to another test.
This article represents the opinion of the Companies operating under the FXOpen brand only. It is not to be construed as an offer, solicitation, or recommendation with respect to products and services provided by the Companies operating under the FXOpen brand, nor is it to be considered financial advice.
According to recent charts, Netflix (NFLX) shares have traded below $1,100 this week — for the first time since late May. The stock has fallen more than 17% from its July peak, while the S&P 500 index remains close to record highs.
Why Has Netflix (NFLX) Fallen?
The main catalyst for the drop was the company’s earnings report, which showed results well below expectations: actual EPS came in at $5.87 versus a forecast of $6.96 and a previous reading of $7.19.
Despite the success of several new releases, the figures were weighed down by a tax dispute in Brazil, which significantly dampened market sentiment. Nevertheless, the bulls still have reasons for cautious optimism.
Technical Analysis of the NFLX Chart
The NFLX share price remains within a long-term upward channel (marked in blue). It has now approached a key support zone formed by:
→ the lower boundary of the main channel, which previously provided support in April;
→ the lower line of a short-term downward trajectory (marked in red);
→ the psychological level of $1,100.
Bulls are taking encouragement from the fact that:
→ the RSI indicator has entered oversold territory;
→ the price previously moved confidently through the $1,000–$1,100 range, suggesting that strong buying interest may still persist in this area.
From the sellers’ perspective, however, attention should be paid to the large bearish gap formed earlier this week, with its lower edge near $1,100, which could now act as resistance.
Taking all this into account, it seems reasonable to assume that:
→ the current support zone may prevent further declines in NFLX shares;
→ the impact of the Brazilian tax case (reported losses of around $600 million) may already be priced in;
→ bulls could attempt to resume the broader uptrend, potentially turning the red trajectory into a bullish flag pattern.
On the other hand, failure to hold within the blue channel would expose the $1,000 level to another test.
This article represents the opinion of the Companies operating under the FXOpen brand only. It is not to be construed as an offer, solicitation, or recommendation with respect to products and services provided by the Companies operating under the FXOpen brand, nor is it to be considered financial advice.
Penafian
Maklumat dan penerbitan adalah tidak bertujuan, dan tidak membentuk, nasihat atau cadangan kewangan, pelaburan, dagangan atau jenis lain yang diberikan atau disahkan oleh TradingView. Baca lebih dalam Terma Penggunaan.
Penafian
Maklumat dan penerbitan adalah tidak bertujuan, dan tidak membentuk, nasihat atau cadangan kewangan, pelaburan, dagangan atau jenis lain yang diberikan atau disahkan oleh TradingView. Baca lebih dalam Terma Penggunaan.