📊 CHART ANALYSIS SUMMARY (from the 4 charts)
From the charts you've given, I’ve identified a few key things:
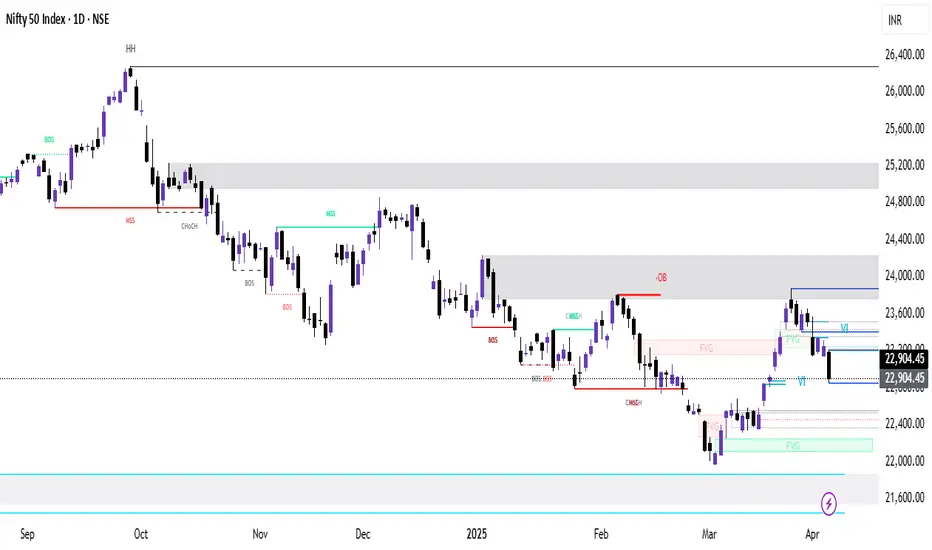
- NIFTY is in a bullish short-term market structure , but it’s tapping into premium prices in a possible higher timeframe redistribution zone.
- There's a liquidity sweep and inducement pattern near the highs.
- Some FVGs (Fair Value Gaps) remain unfilled.
- Possible reversal sell setup from a 4H or daily bearish order block that aligns with premium pricing in a range.
🧠 Step-by-Step ICT/SMC Analysis
1. Market Structure & Bias
- 1H to 4H Structure: The market was pushing higher, making HHs (higher highs) and HLs (higher lows).
- However, the latest high was taken with a wick, showing signs of a **buy-side liquidity raid rather than strength.
- After the raid, price left a bearish FVG (Fair Value Gap) — a classic ICT signature for a reversal.
> 🔎 Interpretation:This is typical SMC inducement : retail traders get trapped buying a breakout, while smart money distributes into those buys and prepares to sell.
2. Key Liquidity Levels
- Buy-side Liquidity (BSL): Taken at recent swing high (~NIFTY 22,520 zone)
- Sell-side Liquidity (SSL): Resting below recent lows (~22,300 and then ~22,150)
> 🧠 SMC logic: Liquidity was engineered and taken at the highs. Now, the market may seek the **sell-side liquidity** next.
3. Order Blocks & Imbalances
- ✅ A clear Bearish Order Block formed near the 22,500–22,520 level on 1H/4H — this was the last up-candle before the sell-off (and a liquidity sweep).
- ✅ There's a clean FVG (Fair Value Gap) just under this OB — price wicked back into it but failed to close above.
> 🧠 ICT logic: Price fills the imbalance slightly, taps the OB, then rejects — suggesting smart money is selling from this zone.
4. Potential Trade Setup (Sell)
🎯 Trade Idea: Intraday / Swing Short
| Component | Level / Description
|--------------------|-------------------------------------------------|
| Bias | Bearish (short-term retracement expected) |
| Entry | ~22,500–22,520 (OB + FVG confluence zone) |
| Stop Loss | Above 22,570 (above the liquidity sweep wick) |
| TP1 | 22,300 (low of range, internal liquidity) |
| TP2 | 22,150 (external liquidity sweep zone) |
| TP3 (optional) | 22,000 (discount zone of full move) |
| R:R | Approx. 1:2.5 to 1:3.5 depending on exit |
🧱 Confluence Checklist
| ICT/SMC Element | Confirmed? | Notes
|----------------------------|------------|-----------------------------------------------------------------------|
| Break of Structure | ✅ | Lower high failed to break previous HH with momentum
| Liquidity Sweep | ✅ | Buy-side taken at the top with a wick
| FVG Presence | ✅ | 1H Fair Value Gap post sweep
| Bearish Order Block | ✅ | Confirmed on 1H and 4H
| Displacement | ✅ | Strong sell candle after sweep
| Retracement to OB/FVG | ✅ | Price returns to OB to mitigate orders
| Premium Pricing Zone | ✅ | Above 50% of the full range (using FIB anchoring)
🔄 Scenario Management
- If price rejects OB and sells off, you’re in good hands — standard SMC setup.
- If price closes above 22,570, the OB is invalidated → exit the short.
- If the setup works, scale partial profits at TP1 and trail to TP2/TP3.
📉 It's not a long-term bearish call on NIFTY — it’s a mean-reversion swing targeting liquidity below.
From the charts you've given, I’ve identified a few key things:
- NIFTY is in a bullish short-term market structure , but it’s tapping into premium prices in a possible higher timeframe redistribution zone.
- There's a liquidity sweep and inducement pattern near the highs.
- Some FVGs (Fair Value Gaps) remain unfilled.
- Possible reversal sell setup from a 4H or daily bearish order block that aligns with premium pricing in a range.
🧠 Step-by-Step ICT/SMC Analysis
1. Market Structure & Bias
- 1H to 4H Structure: The market was pushing higher, making HHs (higher highs) and HLs (higher lows).
- However, the latest high was taken with a wick, showing signs of a **buy-side liquidity raid rather than strength.
- After the raid, price left a bearish FVG (Fair Value Gap) — a classic ICT signature for a reversal.
> 🔎 Interpretation:This is typical SMC inducement : retail traders get trapped buying a breakout, while smart money distributes into those buys and prepares to sell.
2. Key Liquidity Levels
- Buy-side Liquidity (BSL): Taken at recent swing high (~NIFTY 22,520 zone)
- Sell-side Liquidity (SSL): Resting below recent lows (~22,300 and then ~22,150)
> 🧠 SMC logic: Liquidity was engineered and taken at the highs. Now, the market may seek the **sell-side liquidity** next.
3. Order Blocks & Imbalances
- ✅ A clear Bearish Order Block formed near the 22,500–22,520 level on 1H/4H — this was the last up-candle before the sell-off (and a liquidity sweep).
- ✅ There's a clean FVG (Fair Value Gap) just under this OB — price wicked back into it but failed to close above.
> 🧠 ICT logic: Price fills the imbalance slightly, taps the OB, then rejects — suggesting smart money is selling from this zone.
4. Potential Trade Setup (Sell)
🎯 Trade Idea: Intraday / Swing Short
| Component | Level / Description
|--------------------|-------------------------------------------------|
| Bias | Bearish (short-term retracement expected) |
| Entry | ~22,500–22,520 (OB + FVG confluence zone) |
| Stop Loss | Above 22,570 (above the liquidity sweep wick) |
| TP1 | 22,300 (low of range, internal liquidity) |
| TP2 | 22,150 (external liquidity sweep zone) |
| TP3 (optional) | 22,000 (discount zone of full move) |
| R:R | Approx. 1:2.5 to 1:3.5 depending on exit |
🧱 Confluence Checklist
| ICT/SMC Element | Confirmed? | Notes
|----------------------------|------------|-----------------------------------------------------------------------|
| Break of Structure | ✅ | Lower high failed to break previous HH with momentum
| Liquidity Sweep | ✅ | Buy-side taken at the top with a wick
| FVG Presence | ✅ | 1H Fair Value Gap post sweep
| Bearish Order Block | ✅ | Confirmed on 1H and 4H
| Displacement | ✅ | Strong sell candle after sweep
| Retracement to OB/FVG | ✅ | Price returns to OB to mitigate orders
| Premium Pricing Zone | ✅ | Above 50% of the full range (using FIB anchoring)
🔄 Scenario Management
- If price rejects OB and sells off, you’re in good hands — standard SMC setup.
- If price closes above 22,570, the OB is invalidated → exit the short.
- If the setup works, scale partial profits at TP1 and trail to TP2/TP3.
📉 It's not a long-term bearish call on NIFTY — it’s a mean-reversion swing targeting liquidity below.
Penerbitan berkaitan
Penafian
Maklumat dan penerbitan adalah tidak dimaksudkan untuk menjadi, dan tidak membentuk, nasihat untuk kewangan, pelaburan, perdagangan dan jenis-jenis lain atau cadangan yang dibekalkan atau disahkan oleh TradingView. Baca dengan lebih lanjut di Terma Penggunaan.
Penerbitan berkaitan
Penafian
Maklumat dan penerbitan adalah tidak dimaksudkan untuk menjadi, dan tidak membentuk, nasihat untuk kewangan, pelaburan, perdagangan dan jenis-jenis lain atau cadangan yang dibekalkan atau disahkan oleh TradingView. Baca dengan lebih lanjut di Terma Penggunaan.