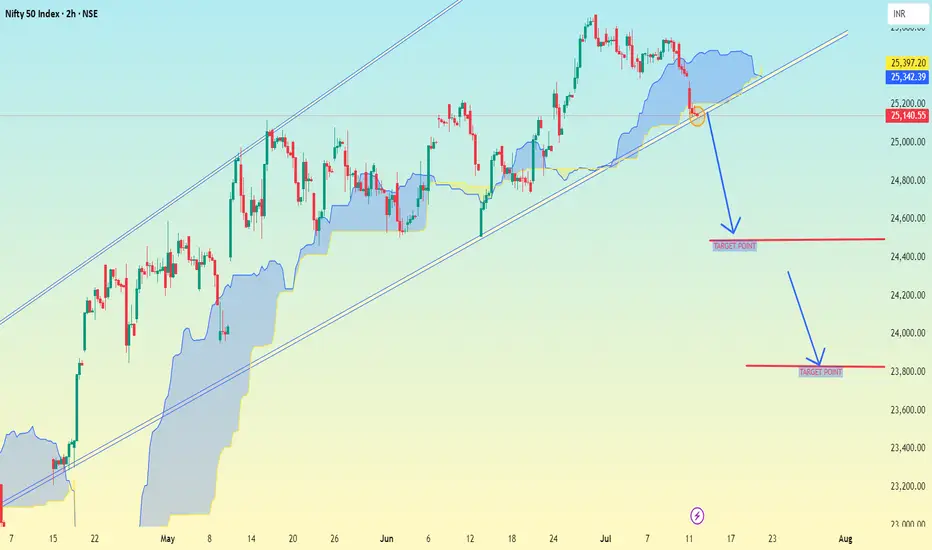
Nifty 50 Index (2h time frame), here is the analysis and potential target levels:
🔍 Technical Breakdown:
Trendline Break: The chart shows a rising trendline which has been broken to the downside.
Ichimoku Cloud: Price has moved below the cloud, indicating bearish momentum.
Arrows & Levels: Two downward arrows suggest potential drop zones.
🎯 Target Levels (as marked on chart):
1. First Target Zone:
📍 Around 24,400
Likely first support zone / take-profit level after breakdown.
2. Second Target Zone:
📍 Around 23,800
Deeper correction zone based on prior support and structure.
✅ Summary:
If the breakdown sustains below the trendline and cloud:
Immediate target: 24,400
Extended target: 23,800
Let me know if you want stop-loss ideas or a risk/reward plan for this trade.
Dagangan aktif
trade activet.me/RSI_Trading_Point4
Forex, gold and crypto signal's with detailed analysis & get consistent results..
t.me/Gold_Analysis_Experiment
Gold signal's with proper TP & SL for high profits opportunities..
Forex, gold and crypto signal's with detailed analysis & get consistent results..
t.me/Gold_Analysis_Experiment
Gold signal's with proper TP & SL for high profits opportunities..
Penerbitan berkaitan
Penafian
Maklumat dan penerbitan adalah tidak dimaksudkan untuk menjadi, dan tidak membentuk, nasihat untuk kewangan, pelaburan, perdagangan dan jenis-jenis lain atau cadangan yang dibekalkan atau disahkan oleh TradingView. Baca dengan lebih lanjut di Terma Penggunaan.
t.me/RSI_Trading_Point4
Forex, gold and crypto signal's with detailed analysis & get consistent results..
t.me/Gold_Analysis_Experiment
Gold signal's with proper TP & SL for high profits opportunities..
Forex, gold and crypto signal's with detailed analysis & get consistent results..
t.me/Gold_Analysis_Experiment
Gold signal's with proper TP & SL for high profits opportunities..
Penerbitan berkaitan
Penafian
Maklumat dan penerbitan adalah tidak dimaksudkan untuk menjadi, dan tidak membentuk, nasihat untuk kewangan, pelaburan, perdagangan dan jenis-jenis lain atau cadangan yang dibekalkan atau disahkan oleh TradingView. Baca dengan lebih lanjut di Terma Penggunaan.