Trend Overview:
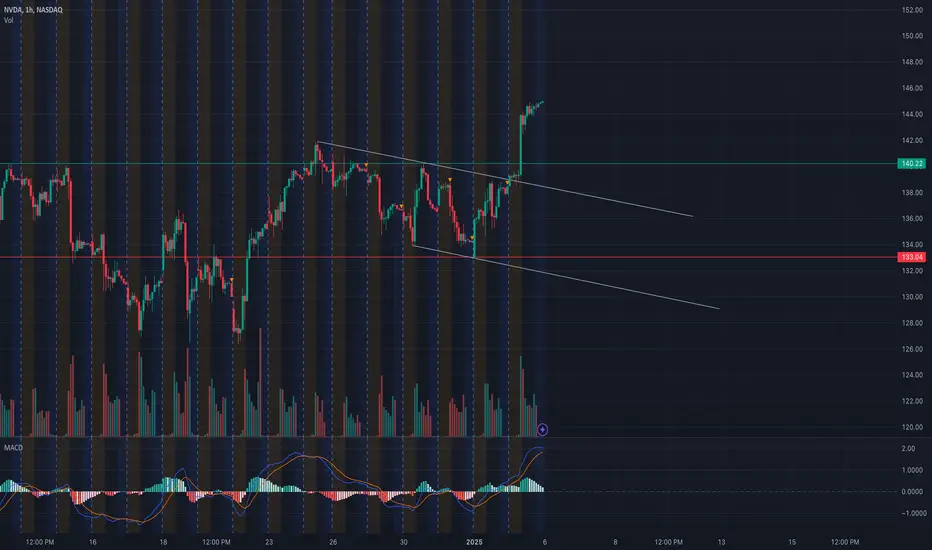
* Current Price Action: NVDA has shown strong bullish momentum, breaking out of a descending trendline on the 1-hour chart. The price has climbed towards significant resistance levels at $145 and $150, indicating robust buying pressure.
* Support Levels: Key support zones are identified at $136 and $133.04. These levels are pivotal if the price sees a pullback.
* Resistance Levels: The immediate resistance lies at $145, followed by $150, which aligns with a psychological and GEX barrier.
Indicators:
* MACD: The MACD on the hourly timeframe indicates a bullish crossover, suggesting upward momentum.
* Volume: Increasing volume supports the breakout above resistance.
* RSI: RSI is nearing overbought territory, warranting caution for a potential pullback.
Scenarios for Tomorrow:
1. Bullish Scenario: If NVDA sustains above $145, it could rally to test $150.
* Entry: Above $145
* Target: $150
* Stop Loss: Below $142
2. Bearish Scenario: A rejection from $145 may lead to a retracement toward $136.
* Entry: Below $143
* Target: $136
* Stop Loss: Above $145

GEX Analysis for Options Trading:
Gamma Exposure (GEX):
* Call Walls:
* Significant resistance at $150, with substantial call positioning.
* $145 also shows elevated gamma exposure, indicating strong option market activity.
* Put Walls:
* Support levels are anchored around $136 and $133, where gamma hedging by market makers could slow downward movement.
Options Strategy for January 6:
1. Bullish Play:
* Strategy: Buy Calls
* Strike Price: $145
* Expiration Date: Closest weekly expiration
* Target: $150
2. Bearish Play:
* Strategy: Buy Puts
* Strike Price: $140
* Expiration Date: Closest weekly expiration
* Target: $136
Disclaimer:
This analysis is for educational purposes only and does not constitute financial advice. Always conduct your own research and manage risk appropriately.
* Current Price Action: NVDA has shown strong bullish momentum, breaking out of a descending trendline on the 1-hour chart. The price has climbed towards significant resistance levels at $145 and $150, indicating robust buying pressure.
* Support Levels: Key support zones are identified at $136 and $133.04. These levels are pivotal if the price sees a pullback.
* Resistance Levels: The immediate resistance lies at $145, followed by $150, which aligns with a psychological and GEX barrier.
Indicators:
* MACD: The MACD on the hourly timeframe indicates a bullish crossover, suggesting upward momentum.
* Volume: Increasing volume supports the breakout above resistance.
* RSI: RSI is nearing overbought territory, warranting caution for a potential pullback.
Scenarios for Tomorrow:
1. Bullish Scenario: If NVDA sustains above $145, it could rally to test $150.
* Entry: Above $145
* Target: $150
* Stop Loss: Below $142
2. Bearish Scenario: A rejection from $145 may lead to a retracement toward $136.
* Entry: Below $143
* Target: $136
* Stop Loss: Above $145
GEX Analysis for Options Trading:
Gamma Exposure (GEX):
* Call Walls:
* Significant resistance at $150, with substantial call positioning.
* $145 also shows elevated gamma exposure, indicating strong option market activity.
* Put Walls:
* Support levels are anchored around $136 and $133, where gamma hedging by market makers could slow downward movement.
Options Strategy for January 6:
1. Bullish Play:
* Strategy: Buy Calls
* Strike Price: $145
* Expiration Date: Closest weekly expiration
* Target: $150
2. Bearish Play:
* Strategy: Buy Puts
* Strike Price: $140
* Expiration Date: Closest weekly expiration
* Target: $136
Disclaimer:
This analysis is for educational purposes only and does not constitute financial advice. Always conduct your own research and manage risk appropriately.
Penafian
Maklumat dan penerbitan adalah tidak dimaksudkan untuk menjadi, dan tidak membentuk, nasihat untuk kewangan, pelaburan, perdagangan dan jenis-jenis lain atau cadangan yang dibekalkan atau disahkan oleh TradingView. Baca dengan lebih lanjut di Terma Penggunaan.
Penafian
Maklumat dan penerbitan adalah tidak dimaksudkan untuk menjadi, dan tidak membentuk, nasihat untuk kewangan, pelaburan, perdagangan dan jenis-jenis lain atau cadangan yang dibekalkan atau disahkan oleh TradingView. Baca dengan lebih lanjut di Terma Penggunaan.