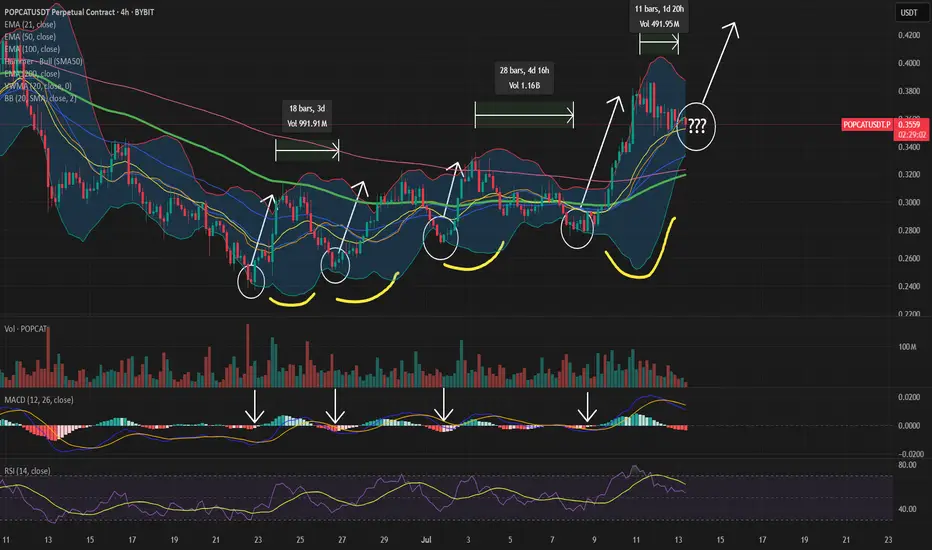
📈 POPCAT 4H Chart Analysis – Bollinger Bands + MACD
Since 22 June, POPCAT has consistently formed higher highs and higher lows, suggesting growing bullish momentum and a potential breakout in sight.
On the 4H timeframe, POPCAT has followed a recurring pattern:
🔁 Bounce from the bottom of the Bollinger Bands → Rally to the top of the bands
This move has repeated on the following dates:
📅 Date 🔽 Support (Lower Band) 🔼 Resistance (Upper Band) 🔍 MACD Signal
22 June 0.238 0.304 Bullish cross
26 June 0.244 0.310 Momentum up
1 July 0.269 0.312 Bullish signal
7 July 0.277 0.308 MACD rising
Each time, the MACD indicator also showed a bullish crossover or increasing momentum, reinforcing the validity of the rally after the bounce.
🔒 Support has been rising, showing buyers are stepping in at higher levels.
📉 Resistance is tightening around 0.310–0.312, suggesting a potential squeeze.
After each rally, POPCAT has consolidated for a few days, pulled back to the lower band, and repeated the move upward. If this pattern continues, another upside rally could occur within 1–2 days.
TL;DR:
POPCAT is respecting a strong Bollinger Band + MACD setup. If it holds above ~0.277 and breaks past 0.312 with volume, we might see a strong continuation to the upside.
What do you think about this setup?
Drop your thoughts and charts in the comments below! 🔽📊🚀
Nota
Important note! Volume have been decreasing each rally. Pay close attention to volumes!NorseCrypto
Penafian
Maklumat dan penerbitan adalah tidak dimaksudkan untuk menjadi, dan tidak membentuk, nasihat untuk kewangan, pelaburan, perdagangan dan jenis-jenis lain atau cadangan yang dibekalkan atau disahkan oleh TradingView. Baca dengan lebih lanjut di Terma Penggunaan.
NorseCrypto
Penafian
Maklumat dan penerbitan adalah tidak dimaksudkan untuk menjadi, dan tidak membentuk, nasihat untuk kewangan, pelaburan, perdagangan dan jenis-jenis lain atau cadangan yang dibekalkan atau disahkan oleh TradingView. Baca dengan lebih lanjut di Terma Penggunaan.