Key Levels (1-Day Time Frame)
Based on data from Investing.com and Moneycontrol:
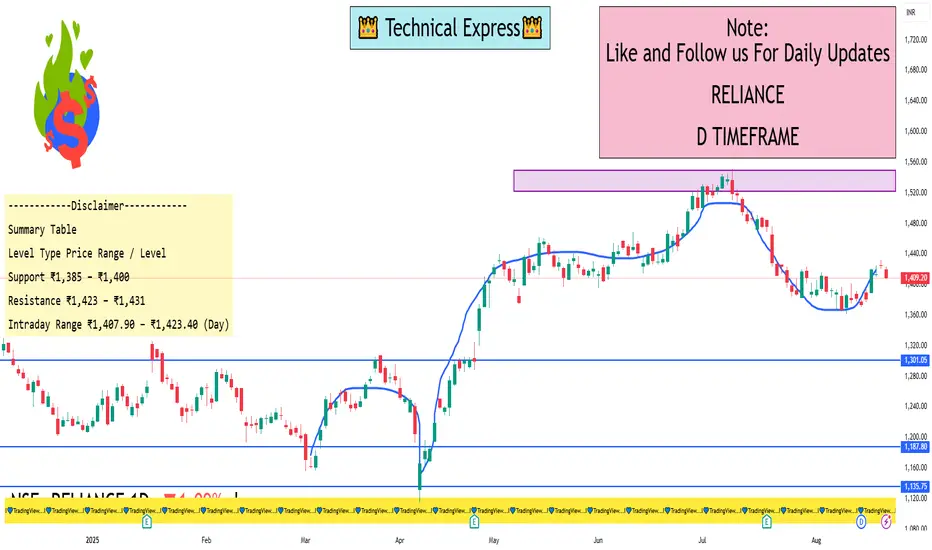
Day’s Range: ₹1,407.90 – ₹1,423.40
Recent Daily High (Aug 21): ₹1,431.90
Recent Daily Low (Aug 11): ₹1,361.20
From chart commentary (TradingView):
Support Zone: ₹1,385–1,400
Resistance Level: Around ₹1,423–1,431
Interpretation & Notes
Intraday activity shows movement between roughly ₹1,408 to ₹1,423.
A daily low near ₹1,408 may serve as short-term support; breaking below could test the ₹1,385–1,400 zone.
On the upside, a close above ₹1,423–1,431 might open potential to push higher.
Remember: technical levels provide guidance, not guarantees—market dynamics and fundamentals can shift price action quickly. Always cross-check with live charts and broader analysis.
Based on data from Investing.com and Moneycontrol:
Day’s Range: ₹1,407.90 – ₹1,423.40
Recent Daily High (Aug 21): ₹1,431.90
Recent Daily Low (Aug 11): ₹1,361.20
From chart commentary (TradingView):
Support Zone: ₹1,385–1,400
Resistance Level: Around ₹1,423–1,431
Interpretation & Notes
Intraday activity shows movement between roughly ₹1,408 to ₹1,423.
A daily low near ₹1,408 may serve as short-term support; breaking below could test the ₹1,385–1,400 zone.
On the upside, a close above ₹1,423–1,431 might open potential to push higher.
Remember: technical levels provide guidance, not guarantees—market dynamics and fundamentals can shift price action quickly. Always cross-check with live charts and broader analysis.
I built a Buy & Sell Signal Indicator with 85% accuracy.
📈 Get access via DM or
WhatsApp: wa.link/d997q0
| Email: techncialexpress@gmail.com
| Script Coder | Trader | Investor | From India
📈 Get access via DM or
WhatsApp: wa.link/d997q0
| Email: techncialexpress@gmail.com
| Script Coder | Trader | Investor | From India
Penerbitan berkaitan
Penafian
Maklumat dan penerbitan adalah tidak dimaksudkan untuk menjadi, dan tidak membentuk, nasihat untuk kewangan, pelaburan, perdagangan dan jenis-jenis lain atau cadangan yang dibekalkan atau disahkan oleh TradingView. Baca dengan lebih lanjut di Terma Penggunaan.