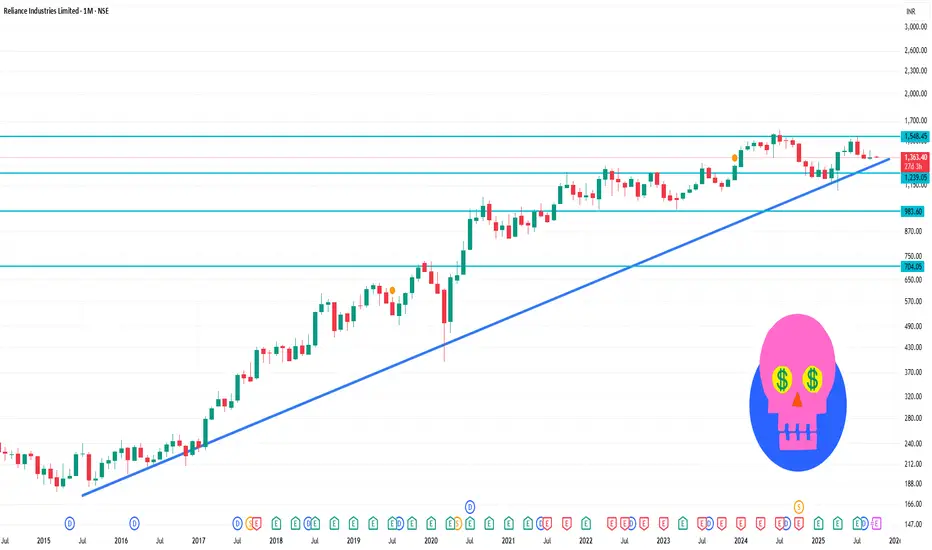
📊 Monthly Pivot Levels (Standard)
Pivot Point: ₹1,375.53
Support Levels:
S1: ₹1,329.07
S2: ₹1,294.13
S3: ₹1,247.67
Resistance Levels:
R1: ₹1,410.47
R2: ₹1,456.93
R3: ₹1,491.87
These levels are derived from standard pivot point calculations, which are commonly used to identify potential support and resistance zones.
🔄 Technical Indicators Overview
Relative Strength Index (RSI): Approximately 41.5, indicating a neutral to slightly bearish condition.
Moving Averages: The stock is trading below its 50-day and 200-day moving averages, suggesting a bearish trend.
MACD: Currently negative, reinforcing the bearish momentum.
Penerbitan berkaitan
Penafian
The information and publications are not meant to be, and do not constitute, financial, investment, trading, or other types of advice or recommendations supplied or endorsed by TradingView. Read more in the Terms of Use.
Penerbitan berkaitan
Penafian
The information and publications are not meant to be, and do not constitute, financial, investment, trading, or other types of advice or recommendations supplied or endorsed by TradingView. Read more in the Terms of Use.