Well, today was a doozy to say the least. Last night I mentioned the bullish hammer for the daily candle, and believe it or not, we formed a bullish red candle today. They are both called hammers and often present this way. I'm not saying this to try and bolster my bullish stance on Rivian. A simple google search of bullish green hammer or bullish red hammer will show you this. That being said, Rivian has a lot of proving to do.
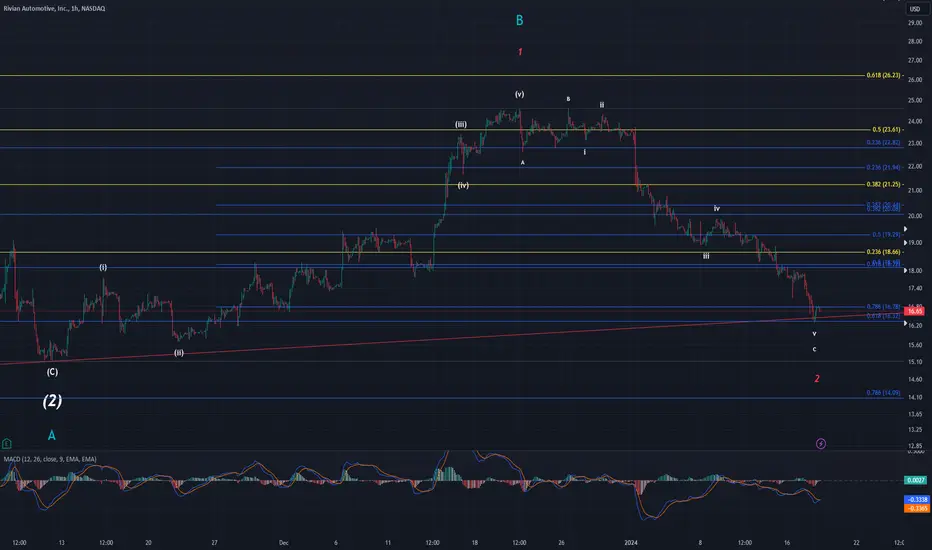
Today we dropped all the way to my primary trend line. Thankfully, it held up and price reversed after tagging it. This area has the 0.618 retracement fib from wave (1) right at my trend line adding support too. Also, it's pretty ugly, but we got a 5-wave move to the upside. Below is the 15min chart with labels showing this. IF, this is the beginning of a move up (and we're running out of opportunities), then I would expect us to drop tomorrow back down to test the trend line before finally raising in wave 3. If it fails and makes another low, then the next line of support I see is $14.09. Below $15.12 and that would invalidate this larger count. It would suggest this has all been part of ((B)) of (2) or the more likely scenario is a larger B wave with-in an even larger decline. There are plenty of reasons for this thing to rise but I won't speculate at this time. Price needs to prove itself and as said before...it's got some work to do.
I'm sure some of y'all are tired of hearing me ramble on about MACD, but we are STILL on positive divergence. We have fallen this far/hard, and it STILL remains on pos div. This is a small hint that most won't pick up on but seems obvious to me. It has been one of the main things that has stayed my belief we are due to raise. MACD isn't the end all be all though, structure is. This structure to the downside we have seen has been strong, but still appears corrective to me. Even if this is continuing the previous bearish trend, we are due for a major retrace at the least. We have fallen almost 34% since the high on 26 December with no real retrace to talk about. Sure, we had a little one on 08 Jan but that is hardly even noticeable when zoomed out to the larger picture. Let's hope tomorrow Rivian starts to cooperate and makes some gains to the upside. There are only so many bullish signs you can get before its stubbornness finally gives...
Nota
Testing the trend line nowNota
This is making me feel my ALT is becoming much more likely. Watch the daily MACD at the bottom of the chart. I don't want to see it cross that line or all bets are off.Go to ewtdaily.com for DETAILED DAILY UPDATES on 27 unique tickers and a daily zoom call with members to discuss latest analysis and get a 7-day FREE trial
Bonam Fortunam,
--Tyler
Bonam Fortunam,
--Tyler
Penafian
Maklumat dan penerbitan adalah tidak dimaksudkan untuk menjadi, dan tidak membentuk, nasihat untuk kewangan, pelaburan, perdagangan dan jenis-jenis lain atau cadangan yang dibekalkan atau disahkan oleh TradingView. Baca dengan lebih lanjut di Terma Penggunaan.
Go to ewtdaily.com for DETAILED DAILY UPDATES on 27 unique tickers and a daily zoom call with members to discuss latest analysis and get a 7-day FREE trial
Bonam Fortunam,
--Tyler
Bonam Fortunam,
--Tyler
Penafian
Maklumat dan penerbitan adalah tidak dimaksudkan untuk menjadi, dan tidak membentuk, nasihat untuk kewangan, pelaburan, perdagangan dan jenis-jenis lain atau cadangan yang dibekalkan atau disahkan oleh TradingView. Baca dengan lebih lanjut di Terma Penggunaan.