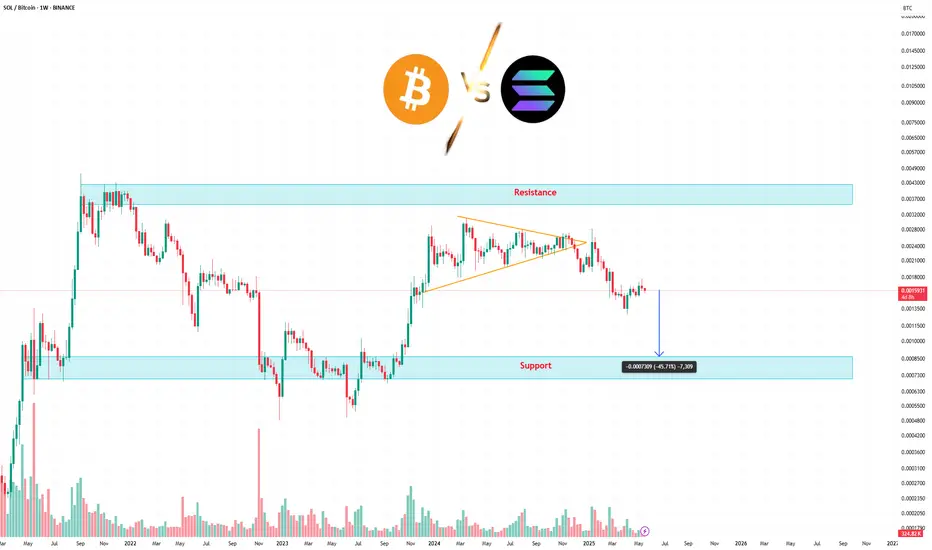
The chart shows a clear weakening of Solana against Bitcoin. After a prolonged sideways phase within a symmetrical triangle, price has broken down, signaling a potential bearish continuation.
🔻 Technical pattern:
Well-defined symmetrical triangle (orange lines) broken to the downside.
Breakdown occurred with rising volume, confirming the validity of the move.
📌 Key levels:
Resistance: 0.00370 – 0.00430 BTC (strong supply zone, repeatedly rejected).
Support: 0.00073 – 0.00110 BTC (historical potential bounce zone).
Price is currently heading toward support, with a theoretical target around 0.00110 BTC, in line with the triangle’s height.
📊 Volume:
Gradual decline during the triangle formation.
Volume spike on breakdown – a confirmation signal.
⚠️ Observations:
The SOL/BTC pair is showing clear relative weakness vs BTC.
If the highlighted support zone fails to hold, new local lows may be in sight.
Potential reversal signals would require a reclaim of resistance or evident accumulation near support.
🚀Get free crypto signals, strategies, market insights & tools I personally use.
📌 t.me/cryptolvke
📌 t.me/cryptolvke
Penafian
Maklumat dan penerbitan adalah tidak dimaksudkan untuk menjadi, dan tidak membentuk, nasihat untuk kewangan, pelaburan, perdagangan dan jenis-jenis lain atau cadangan yang dibekalkan atau disahkan oleh TradingView. Baca dengan lebih lanjut di Terma Penggunaan.