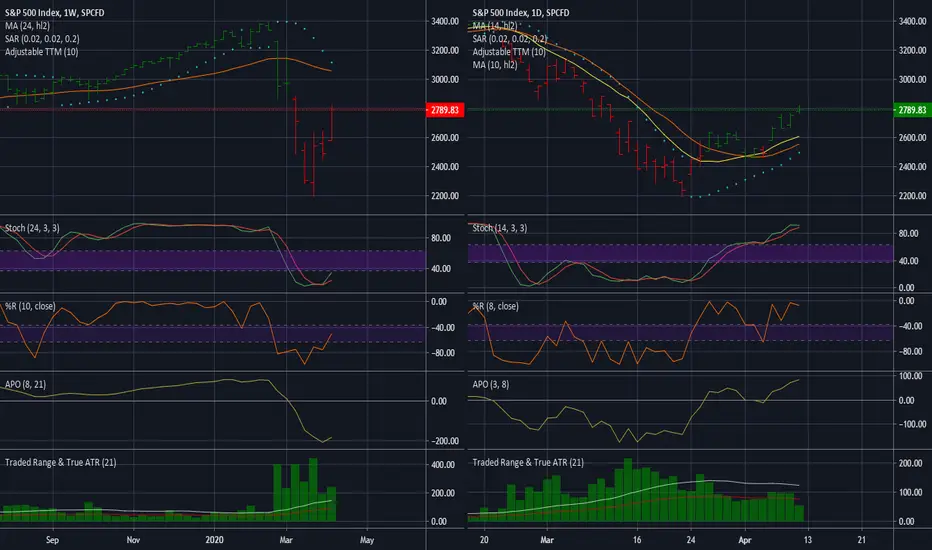
Weekly Data Summary Suggests:
Current Weekly Trend (price relationship to the trend MA) is Bearish
The price relationship to the moving averages currently suggest closing shorts and protecting profit.
Current chart score suggests that Bearish Sentiment is present.
The anticipated upcoming trade range is between 2690.99 - 2862.29
Price Consolidation has formed between: 2191.86 - 2882.59
If SPX is capable of maintaining the current strength as of today, the projection generated from the weekly chart is a target price of 2940
Out of the combined (weekly & daily) indicators monitored, 41.67% are bearish, 50.00% are bullish and 8.33% are neutral
Price movement has returned to the Trending Moving Average this suggests either a stall while averages catch up to the prices or a turn in the prices in the opposite direction
The RSI that monitors bullish strength has a current weekly reading of: Neutral Bear
The RSI that monitors bearish strength has a current weekly reading of: Bearish
The strength demonstrated over the last 5 weeks is currently: Bullish
Daily Data Summary Suggests:
Current Daily Trend (price relationship to the trend MA) is Bullish
The price relationship to the moving averages currently suggest Long positions.
Current chart score suggests that Bullish Sentiment is present.
The anticipated upcoming trade range is between 2683.07 - 2935.45
Prices have broken through the consolidation high
If SPX is capable of maintaining the current strength as of today, the projection generated from the daily chart is a target price of 2891.11
The prices are moving with the Trending Moving Average at a standard pace with a moderate market
The RSI that monitors bullish strength has a current daily reading of: Bullish
The RSI that monitors bearish strength has a current daily reading of: Neutral Bull
The strength demonstrated over the last 5 days is currently: Bullish
Comments:
STD DEV for the coming week: 2489 - 3089
STD DEV for Monday 13 April 2020: 2662 - 2917
I am flagging neutral because of the mix between weekly indicators and daily indicators pointing in opposite directions. I would need 20% of the weekly indicators to have switched direction before I stop being neutral.
Happy Easter every one! Hope you had a good holiday weekend.
Stay safe, trade safe!
** If data does not significantly change between trade dates, a daily update may be skipped. Monthly and Weekly updates will always be provided. **
Penafian
Maklumat dan penerbitan adalah tidak dimaksudkan untuk menjadi, dan tidak membentuk, nasihat untuk kewangan, pelaburan, perdagangan dan jenis-jenis lain atau cadangan yang dibekalkan atau disahkan oleh TradingView. Baca dengan lebih lanjut di Terma Penggunaan.
Penafian
Maklumat dan penerbitan adalah tidak dimaksudkan untuk menjadi, dan tidak membentuk, nasihat untuk kewangan, pelaburan, perdagangan dan jenis-jenis lain atau cadangan yang dibekalkan atau disahkan oleh TradingView. Baca dengan lebih lanjut di Terma Penggunaan.