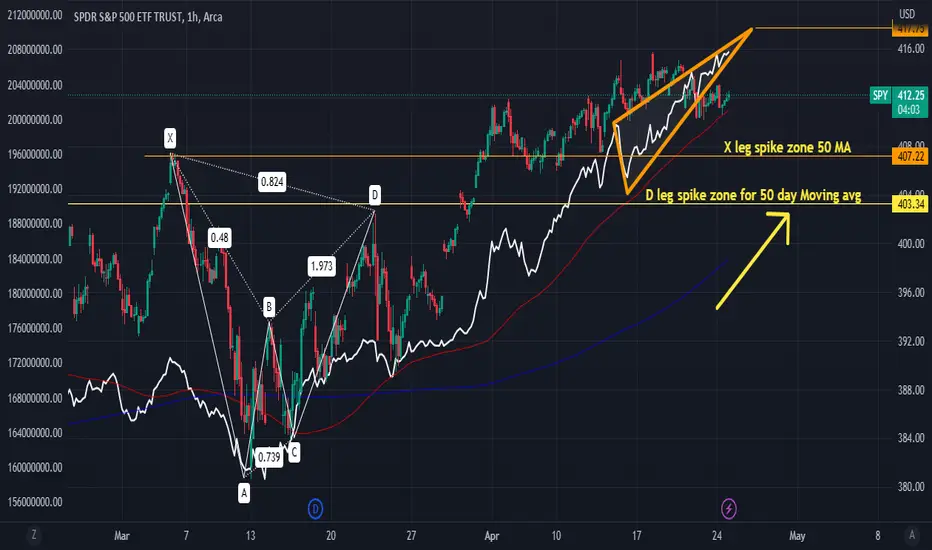
The 50 Day Moving avg is looking to cross both D leg, and X leg of the Bearish Cypher pattern. These are past resistances levels, once both these levels are crossed over. I fully anticipate price action to go higher. In Fact the AD has an ascending Triangle Pattern to 417 on the 1hr time frame. For short term traders and swing traders this is a bullish set up
Nota
everything coincides with previous chart and everything has remain in the upward channel Nota
Nota
looking for the 50 day ma to continue the upward trend and cross over X leg resistances, You saw the spike once it crossed over D leg resistances. and D leg previous resistance level became support.Nota
since I know this is heading to 475, long term in play. with continuous bat like patterns w/ folks taking profits on theNota
417-420 likely dump/correction area for retrace back to X leg right before 50 moving crosses over and gives spike to 430 potential run .. will take time to unfold if theory is true likely summer end of june. i'll come back and see if this has retrace to 407 Nota
this is what I mean by continuation patterns, and how I see profits. look at these multiple bat type patterns structures being created. Nota
i'll make a separate post about thatPenerbitan berkaitan
Penafian
Maklumat dan penerbitan adalah tidak dimaksudkan untuk menjadi, dan tidak membentuk, nasihat untuk kewangan, pelaburan, perdagangan dan jenis-jenis lain atau cadangan yang dibekalkan atau disahkan oleh TradingView. Baca dengan lebih lanjut di Terma Penggunaan.
Penerbitan berkaitan
Penafian
Maklumat dan penerbitan adalah tidak dimaksudkan untuk menjadi, dan tidak membentuk, nasihat untuk kewangan, pelaburan, perdagangan dan jenis-jenis lain atau cadangan yang dibekalkan atau disahkan oleh TradingView. Baca dengan lebih lanjut di Terma Penggunaan.