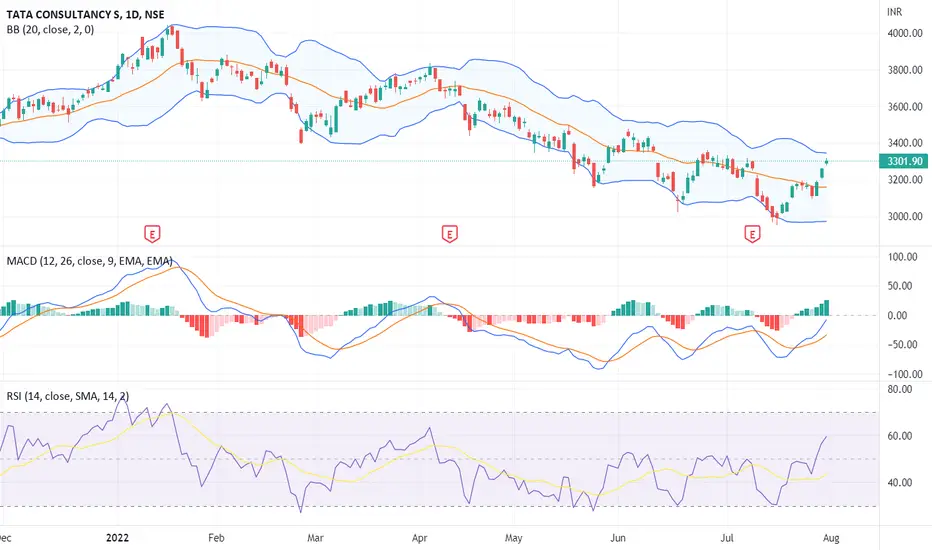
📊 Script: TCS
📊 Nifty50 Stock: YES & Nifty IT
📊 Sector: Information Technology Services.
This stock pick is according to my study. I have use 4 indicator that is
BOLLINGER BAND
MACD
RSI
DOUBLE MOVING AVERAGE
📈 Stock is trading near at upper band of BB.
📈 There is MACD crossover.
📈 RSI is around 59.
📈 There is crossover of double moving average.
🟢 Target 🎯🏆 - 3498
⚠️ Stoploss ☠️🚫 - 3231
⚠️ Important: Always maintain your Risk & Reward Ratio.
✅Like and follow to never miss a new idea!✅
Disclaimer: I am not SEBI Registered Advisor. My posts are purely for training and educational purposes.
Dagangan aktif
Dagangan ditutup: hentian tercapai
STOPLOSS HIT ON 25th AUGPenafian
Maklumat dan penerbitan adalah tidak bertujuan, dan tidak membentuk, nasihat atau cadangan kewangan, pelaburan, dagangan atau jenis lain yang diberikan atau disahkan oleh TradingView. Baca lebih dalam Terma Penggunaan.
Penafian
Maklumat dan penerbitan adalah tidak bertujuan, dan tidak membentuk, nasihat atau cadangan kewangan, pelaburan, dagangan atau jenis lain yang diberikan atau disahkan oleh TradingView. Baca lebih dalam Terma Penggunaan.