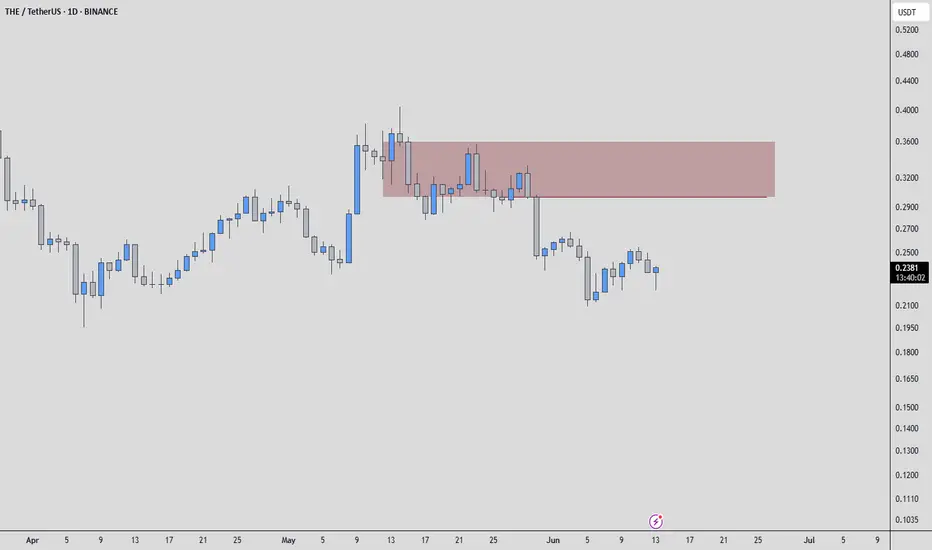
On THEUSDT, my current observation is clear: buyers are extremely weak. This isn't just a hunch; the underlying order flow and volume dynamics point to a lack of conviction from the bullish side.
Because of this noticeable weakness, my focus will be squarely on the red box I've identified on the chart. This area is where I'll be actively seeking downward confirmations on lower timeframes. This means I'm looking for signs like:
Failed attempts to rally: Price pushing up into the red box but quickly getting rejected.
Increased selling volume: A spike in volume on bearish candles as price interacts with or breaks below this zone, especially on the volume footprint.
CDV (Cumulative Delta Volume) turning decisively negative: This would signal that sellers are genuinely taking control.
Low Timeframe (LTF) breakdowns: Clear bearish structures forming, like lower highs and lower lows, coupled with retests of broken support as new resistance.
Remember, my strategy dictates that I only analyze and consider trades on coins showing a sudden and significant increase in volume. While THEUSDT's current context may not be about a sudden bullish volume spike, the analysis of existing volume and order flow within this weakness is crucial.
The market rewards patience and confirmation. I will not be looking for long opportunities here. My attention is entirely focused on finding those bearish confirmations within the red box. If they materialize, it presents a clear directional bias for a downside move.
📌I keep my charts clean and simple because I believe clarity leads to better decisions.
📌My approach is built on years of experience and a solid track record. I don’t claim to know it all but I’m confident in my ability to spot high-probability setups.
📌If you would like to learn how to use the heatmap, cumulative volume delta and volume footprint techniques that I use below to determine very accurate demand regions, you can send me a private message. I help anyone who wants it completely free of charge.
🔑I have a long list of my proven technique below:
I stopped adding to the list because it's kinda tiring to add 5-10 charts in every move but you can check my profile and see that it goes on..
Because of this noticeable weakness, my focus will be squarely on the red box I've identified on the chart. This area is where I'll be actively seeking downward confirmations on lower timeframes. This means I'm looking for signs like:
Failed attempts to rally: Price pushing up into the red box but quickly getting rejected.
Increased selling volume: A spike in volume on bearish candles as price interacts with or breaks below this zone, especially on the volume footprint.
CDV (Cumulative Delta Volume) turning decisively negative: This would signal that sellers are genuinely taking control.
Low Timeframe (LTF) breakdowns: Clear bearish structures forming, like lower highs and lower lows, coupled with retests of broken support as new resistance.
Remember, my strategy dictates that I only analyze and consider trades on coins showing a sudden and significant increase in volume. While THEUSDT's current context may not be about a sudden bullish volume spike, the analysis of existing volume and order flow within this weakness is crucial.
The market rewards patience and confirmation. I will not be looking for long opportunities here. My attention is entirely focused on finding those bearish confirmations within the red box. If they materialize, it presents a clear directional bias for a downside move.
📌I keep my charts clean and simple because I believe clarity leads to better decisions.
📌My approach is built on years of experience and a solid track record. I don’t claim to know it all but I’m confident in my ability to spot high-probability setups.
📌If you would like to learn how to use the heatmap, cumulative volume delta and volume footprint techniques that I use below to determine very accurate demand regions, you can send me a private message. I help anyone who wants it completely free of charge.
🔑I have a long list of my proven technique below:
- 🎯 ZENUSDT.P: Patience & Profitability | %230 Reaction from the Sniper Entry
- 🐶 DOGEUSDT.P: Next Move
- 🎨 RENDERUSDT.P: Opportunity of the Month
- 💎 ETHUSDT.P: Where to Retrace
- 🟢 BNBUSDT.P: Potential Surge
- 📊 BTC Dominance: Reaction Zone
- 🌊 WAVESUSDT.P: Demand Zone Potential
- 🟣 UNIUSDT.P: Long-Term Trade
- 🔵 XRPUSDT.P: Entry Zones
- 🔗 LINKUSDT.P: Follow The River
- 📈 BTCUSDT.P: Two Key Demand Zones
- 🟩 POLUSDT: Bullish Momentum
- 🌟 PENDLEUSDT.P: Where Opportunity Meets Precision
- 🔥 BTCUSDT.P: Liquidation of Highly Leveraged Longs
- 🌊 SOLUSDT.P: SOL's Dip - Your Opportunity
- 🐸 1000PEPEUSDT.P: Prime Bounce Zone Unlocked
- 🚀 ETHUSDT.P: Set to Explode - Don't Miss This Game Changer
- 🤖 IQUSDT: Smart Plan
- ⚡️ PONDUSDT: A Trade Not Taken Is Better Than a Losing One
- 💼 STMXUSDT: 2 Buying Areas
- 🐢 TURBOUSDT: Buy Zones and Buyer Presence
- 🌍 ICPUSDT.P: Massive Upside Potential | Check the Trade Update For Seeing Results
- 🟠 IDEXUSDT: Spot Buy Area | %26 Profit if You Trade with MSB
- 📌 USUALUSDT: Buyers Are Active + %70 Profit in Total
- 🌟 FORTHUSDT: Sniper Entry +%26 Reaction
- 🐳 QKCUSDT: Sniper Entry +%57 Reaction
- 📊 BTC.D: Retest of Key Area Highly Likely
- 📊 XNOUSDT %80 Reaction with a Simple Blue Box!
- 📊 BELUSDT Amazing %120 Reaction!
- 📊 Simple Red Box, Extraordinary Results
- 📊 TIAUSDT | Still No Buyers—Maintaining a Bearish Outlook
- 📊 OGNUSDT | One of Today’s Highest Volume Gainers – +32.44%
- 📊 TRXUSDT - I Do My Thing Again 📊 FLOKIUSDT - +%100 From Blue Box! 📊 SFP/USDT - Perfect Entry %80 Profit! 📊 [https://www.tradingview.com/chart/AAVEUSDT/RZ4eezbi-AAVEUSDT-Analysis-Retracement-Opportunity/]AAVEUSDT - WE DID IT AGAIN!
I stopped adding to the list because it's kinda tiring to add 5-10 charts in every move but you can check my profile and see that it goes on..
Professional Day Trader
Microstructure Practicioner
t.me/umuttrades
kick.com/umuttrades live everyday.
Microstructure Practicioner
t.me/umuttrades
kick.com/umuttrades live everyday.
Penerbitan berkaitan
Penafian
Maklumat dan penerbitan adalah tidak dimaksudkan untuk menjadi, dan tidak membentuk, nasihat untuk kewangan, pelaburan, perdagangan dan jenis-jenis lain atau cadangan yang dibekalkan atau disahkan oleh TradingView. Baca dengan lebih lanjut di Terma Penggunaan.