Overview: TSLA matched our expectations almost perfectly. Let's review the key points of that update:
Update: TSLA developed wave II of C of (Y) in this week, as we expected, it just went higher than our potential target area. Let's look at the hourly chart to see what is the development state of this wave:
It seems wave II developed as a flat and we are in it's wave (c).

Potential target for wave II peak (300.8-307.7):
1) Retracement of wave I: 303.22, 304.29, and 307.68
2) Volume profile of wave I: 300.8, 303.76, and 306.72

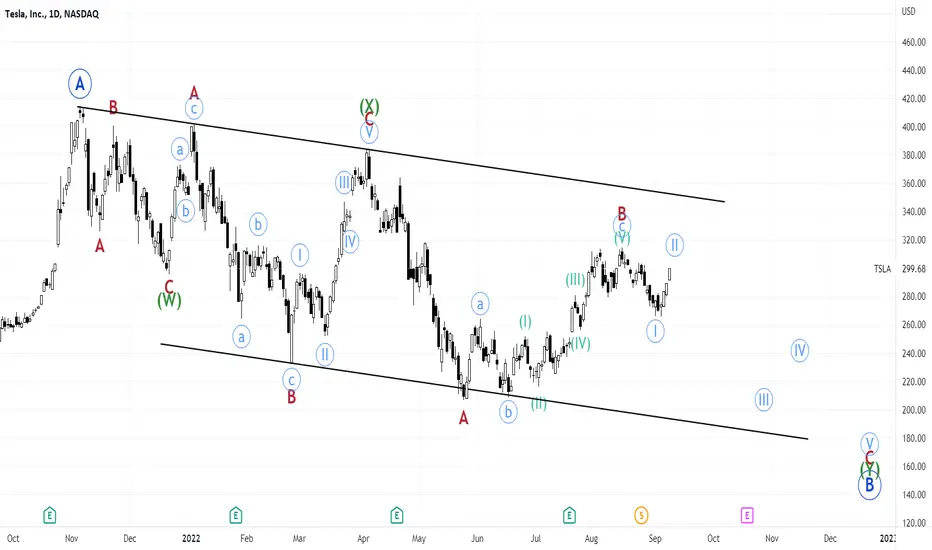
- Looking at the hourly chart, I think wave I is now complete and we are in the process of wave II.
- Potential targets for wave II peak? 282.31-292
Update: TSLA developed wave II of C of (Y) in this week, as we expected, it just went higher than our potential target area. Let's look at the hourly chart to see what is the development state of this wave:
It seems wave II developed as a flat and we are in it's wave (c).
Potential target for wave II peak (300.8-307.7):
1) Retracement of wave I: 303.22, 304.29, and 307.68
2) Volume profile of wave I: 300.8, 303.76, and 306.72
Penerbitan berkaitan
Penafian
Maklumat dan penerbitan adalah tidak dimaksudkan untuk menjadi, dan tidak membentuk, nasihat untuk kewangan, pelaburan, perdagangan dan jenis-jenis lain atau cadangan yang dibekalkan atau disahkan oleh TradingView. Baca dengan lebih lanjut di Terma Penggunaan.
Penerbitan berkaitan
Penafian
Maklumat dan penerbitan adalah tidak dimaksudkan untuk menjadi, dan tidak membentuk, nasihat untuk kewangan, pelaburan, perdagangan dan jenis-jenis lain atau cadangan yang dibekalkan atau disahkan oleh TradingView. Baca dengan lebih lanjut di Terma Penggunaan.