1. Key Observations from the Chart:
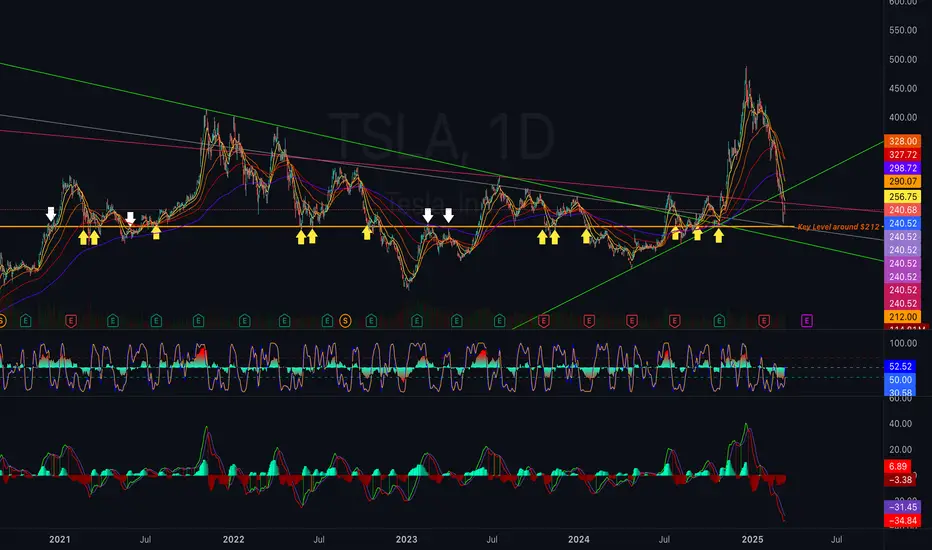
• Recent Selloff: TSLA has seen a significant decline from its recent high near $480 and is currently testing key support zones.
• Major Support & Resistance Levels Identified:
• Resistance Levels:
• $256.75 – Previously strong support, now acting as resistance.
• $290.07 – Another key resistance level (previous major pivot).
• $327.72 - $328.00 – Strong confluence zone, likely to reject price if tested.
• Support Levels:
• $240.68 – Testing this zone right now.
• $212.00 - Key Long-Term Support Zone (Highlighted on the chart, critical level).
• Below $212.00 could mean significant downside risk.
⸻
2. Trend Analysis & Chart Patterns
• Downtrend Confirmed: Price is clearly moving lower, with the 200-day EMA and trendlines confirming bearish pressure.
• Testing Key Support ($240.68): If this breaks, the next major support is around $212.00.
• Descending Resistance Line (Green Line) Could Act as Rejection If Price Bounces.
⸻
3. Indicator Analysis
Stochastic RSI (Middle Panel - Momentum Indicator)
• Currently near neutral levels (~52.52)
• Not oversold yet, meaning TSLA could still see more downside before a true bounce.
MACD (Bottom Panel - Trend & Momentum)
• Bearish MACD Cross Confirmed:
• MACD histogram is deeply negative, signaling strong selling momentum.
• No clear signs of reversal yet.
Nota
4. Prediction for Tomorrow (March 14, 2025)
🔵 Bullish Scenario (If TSLA Holds $240 & Reclaims $256)
• Trigger: TSLA bounces off $240 and breaks $256 with strength
• Target 1: $256.75
• Target 2: $290.07
• Probability: Medium (needs strong buying volume).
🔴 Bearish Scenario (If TSLA Breaks Below $240.68 & Closes Below It)
• Trigger: TSLA falls under $240.68 and holds below
• Target 1: $212.00 (Key long-term support)
• Probability: High (Trend & momentum indicators suggest further downside).
Nota
📊 How to Trade These Levels• Above Pivot ($250.75) → Bullish Bias:
• If TSLA breaks $256.75, expect a push toward $266.50.
• Trade idea: Buy Calls or Bullish Spreads.
• Below Pivot ($250.75) → Bearish Bias:
• If TSLA fails $240.68, expect a drop toward $231.20.
• Trade idea: Buy Puts or Bearish Spreads.
• If TSLA stays between $240 - $256 (Choppy Action):
• Consider Iron Condor or Credit Spreads for range-bound movement.
⸻
🚀 Pro Tip:
• Pre-Market Action: Watch how TSLA trades near $240.68.
• Opening Bell: If it reclaims $250, look for a breakout toward $256.
• Failure Below $240: Momentum could send TSLA toward $231 - $212 quickly.
TSLA Options Trade Recommendations for March 14, 2025
(Based on real-time pivot levels and expected price action)
⸻
🚀 Bullish Trade Ideas (If TSLA Holds Above $250 & Breaks $256)
1. 0DTE Call Option (High Risk, High Reward)
• Buy TSLA $260 Call (Exp. 3/14)
• Entry: If TSLA breaks above $256.75 and holds
• Exit Target: $266-$270
• Stop-Loss: If TSLA falls back below $250
2. Bull Call Spread (Lower Risk)
• Buy TSLA $255 Call (Exp. 3/14)
• Sell TSLA $265 Call (Exp. 3/14)
• Max Profit if TSLA closes above $265
3. Sell a Bull Put Spread (Credit Strategy)
• Sell TSLA $250 Put
• Buy TSLA $245 Put
• Profit if TSLA stays above $250
⸻
🔻 Bearish Trade Ideas (If TSLA Breaks Below $240.68 & Momentum Continues)
1. 0DTE Put Option (High Risk, High Reward)
• Buy TSLA $235 Put (Exp. 3/14)
• Entry: If TSLA breaks below $240.68
• Exit Target: $231 or lower
• Stop-Loss: If TSLA reclaims $245
2. Bear Put Spread (Safer Play)
• Buy TSLA $240 Put (Exp. 3/14)
• Sell TSLA $230 Put (Exp. 3/14)
• Max Profit if TSLA closes below $230
3. Sell a Bear Call Spread (Credit Strategy)
• Sell TSLA $255 Call
• Buy TSLA $260 Call
• Profit if TSLA stays below $255
⸻
⚖️ Neutral Strategy (If TSLA Stays Between $240-$256)
Iron Condor (Best for Low Volatility)
• Sell TSLA $265 Call
• Buy TSLA $270 Call
• Sell TSLA $235 Put
• Buy TSLA $230 Put
• Profit if TSLA stays between $235-$265
⸻
Final Trade Plan for Tomorrow (3/14/2025)
• Bullish 🟢 → Enter calls or bull spreads if TSLA breaks $256.75.
• Bearish 🔴 → Enter puts or put spreads if TSLA breaks below $240.68.
• Choppy/Sideways ⚖️ → Consider an Iron Condor or Credit Spreads.
As always, please let me know if you see something I didn't catch.
Penafian
Maklumat dan penerbitan adalah tidak dimaksudkan untuk menjadi, dan tidak membentuk, nasihat untuk kewangan, pelaburan, perdagangan dan jenis-jenis lain atau cadangan yang dibekalkan atau disahkan oleh TradingView. Baca dengan lebih lanjut di Terma Penggunaan.