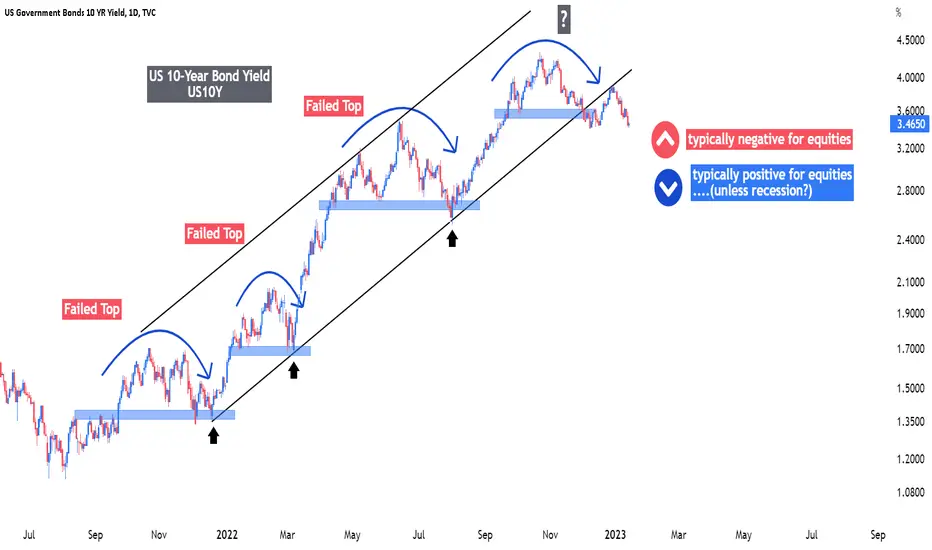
US 10-Year Bond Yield | Chart #1 | The rejection of the re-test of the channel breakdown is seeing further downside follow-through. The yield is trading near the early-December lows of 3.4% of which a downside breach would create a further short term technical tailwind for bonds (i.e. yields down, bond prices up).
US 10-Year Bond Yield | Chart #2 (not shown) | Note that the yield is close to it's first re-test of it's rising 200-day moving average since 29 December 2021. Usually, the 1st test after a prolonged absense is met with support, possible an overshoot to the downside followed by a rebound. Let's see how it acts if and when it gets there.
US 10-Year Bond Yield | Chart #2 (not shown) | Note that the yield is close to it's first re-test of it's rising 200-day moving average since 29 December 2021. Usually, the 1st test after a prolonged absense is met with support, possible an overshoot to the downside followed by a rebound. Let's see how it acts if and when it gets there.
Penafian
Maklumat dan penerbitan adalah tidak dimaksudkan untuk menjadi, dan tidak membentuk, nasihat untuk kewangan, pelaburan, perdagangan dan jenis-jenis lain atau cadangan yang dibekalkan atau disahkan oleh TradingView. Baca dengan lebih lanjut di Terma Penggunaan.
Penafian
Maklumat dan penerbitan adalah tidak dimaksudkan untuk menjadi, dan tidak membentuk, nasihat untuk kewangan, pelaburan, perdagangan dan jenis-jenis lain atau cadangan yang dibekalkan atau disahkan oleh TradingView. Baca dengan lebih lanjut di Terma Penggunaan.