US30 Bullish Breakout Setup -4H Timeframe Analysis
Title:
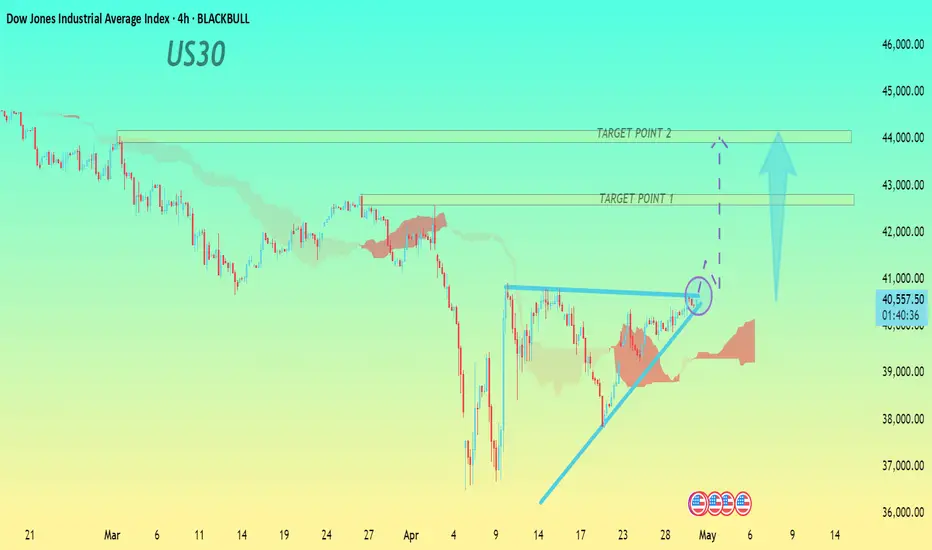
"US30 Bullish Breakout Setup – 4H Timeframe (Chart Pattern Analysis)"
Entry Point:
Consider entering a buy trade upon a confirmed breakout above the resistance trendline (around 40,800 – 41,000 zone), marked by the blue circle.
Target Point 1:
First target is around 42,500, which aligns with the first resistance zone and previous price structure.
Target Point 2:
Second (extended) target is near 44,000, where the next major resistance zone is marked.
Stop-Loss (SL):
Set SL below the breakout structure and ascending trendline, around 39,500 – 39,700, to manage risk if the breakout fails.
The chart illustrates a bullish ascending triangle pattern, suggesting accumulation before a breakout. The price is also supported by Ichimoku cloud structure showing a possible bullish shift. A breakout above resistance could trigger a strong move toward the outlined targets, offering a solid risk-reward opportunity.
Dagangan aktif
US30 running in profit Penafian
Maklumat dan penerbitan adalah tidak dimaksudkan untuk menjadi, dan tidak membentuk, nasihat untuk kewangan, pelaburan, perdagangan dan jenis-jenis lain atau cadangan yang dibekalkan atau disahkan oleh TradingView. Baca dengan lebih lanjut di Terma Penggunaan.
Penafian
Maklumat dan penerbitan adalah tidak dimaksudkan untuk menjadi, dan tidak membentuk, nasihat untuk kewangan, pelaburan, perdagangan dan jenis-jenis lain atau cadangan yang dibekalkan atau disahkan oleh TradingView. Baca dengan lebih lanjut di Terma Penggunaan.