Double Top Pattern Signals Bearish Reversal (Short Trade Active
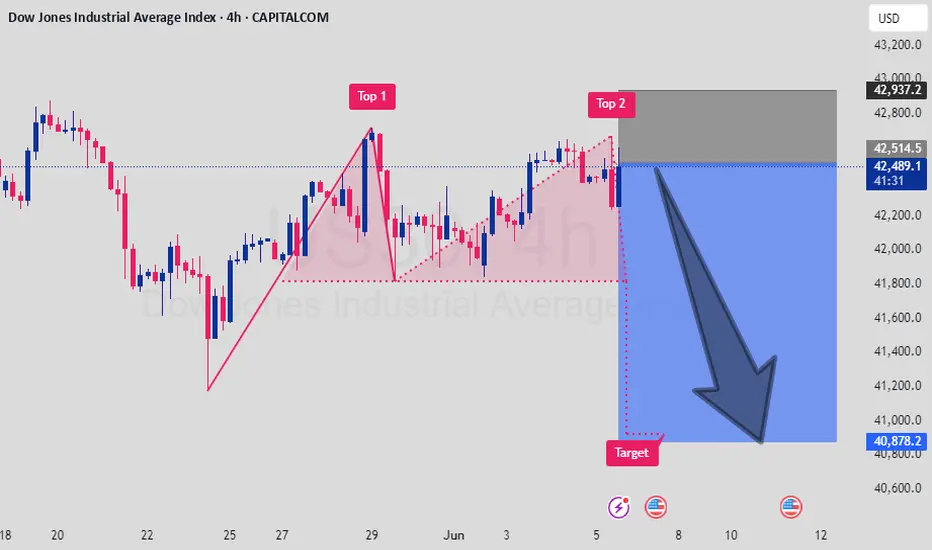
The Dow Jones Industrial Average Index (DJI) on the 4H chart has formed a Double Top pattern, indicating potential trend exhaustion and bearish reversal. The price was rejected near 42,900 twice and has now broken below the neckline, triggering a short trade setup.
🔹 Pattern: Double Top
🔹 Resistance Zone: 42,900 – 43,000
🔹 Neckline Break: ~42,450
🔹 Target Area: 40,878 based on pattern projection
🔹 Fundamental Context: Profit-taking and market uncertainty post recent highs
Bearish momentum active – trade remains valid unless price reclaims and holds above 42,950. Short setup is technically and structurally supported. 📉🧭
Note : If you found this helpful, like and follow for more trade ideas!
Share My Idea With Your Firends Mention Your Feed back Comment Section
This is not financial advice. Please conduct your own research and manage risk accordingly.
For More Help
Telegram @Signals_98
t.me/+HZOTWoeqVoo3M2Nk
Our Channel
t.me/+HZOTWoeqVoo3M2Nk
Telegram @Signals_98
t.me/+HZOTWoeqVoo3M2Nk
Our Channel
t.me/+HZOTWoeqVoo3M2Nk
Penafian
Maklumat dan penerbitan adalah tidak dimaksudkan untuk menjadi, dan tidak membentuk, nasihat untuk kewangan, pelaburan, perdagangan dan jenis-jenis lain atau cadangan yang dibekalkan atau disahkan oleh TradingView. Baca dengan lebih lanjut di Terma Penggunaan.