USDT Dominance – Diagonal Ending? | Wave F in Progress
🔸 Market Structure:
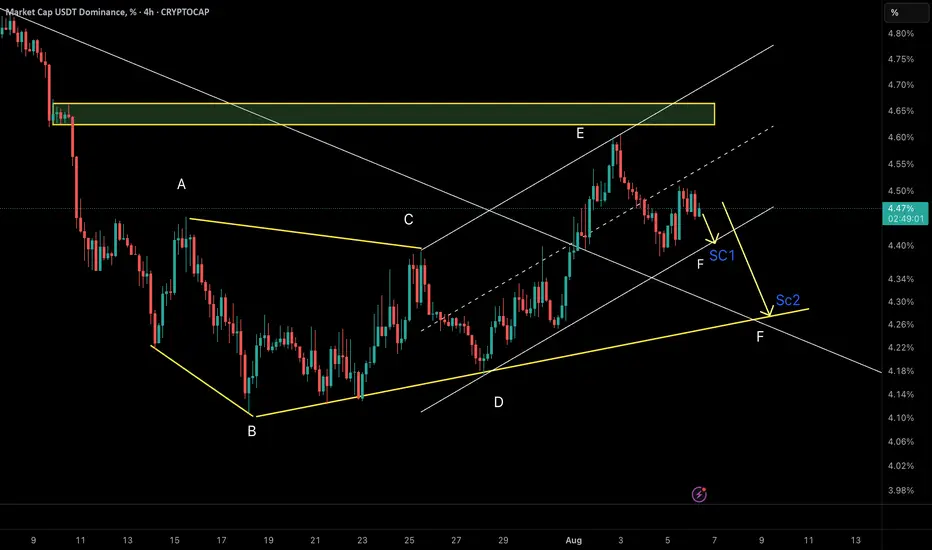
Tether dominance is currently unfolding in a contracting diagonal (Diametric) formation, and we are now in wave F of the structure. Diagonals typically alternate in direction and converge toward a terminal point.
⸻
🔸 Key Observations:
• Price has rejected from the top of wave E
• Wave F is now unfolding as a corrective move down
• Two potential targets are identified for wave F completion
⸻
🔹 Scenario 1 (Sc1): 4.40%
• Short-term ascending trendline support
• Possibility of a shallow correction before another bounce
• Less ideal in terms of geometric balance of the diametric
🔹 Scenario 2 (Sc2): 4.28%
• Aligns with the lower boundary of the diametric pattern
• Converges near previous demand/resistance flip zone
• Better symmetry and structure for a completed wave F
• This scenario is currently more probable
⸻
🎯 Expected Path:
Wave F likely targets 4.28% before any significant bounce, aligning with a complete structure.
⸻
📌 Summary:
USDT dominance is likely in the final stages of a Diametric pattern. We’re watching for signs of completion around 4.28%, which aligns better structurally. A bounce from 4.40% is possible, but less favored unless strong bullish evidence appears.
Dagangan aktif
Scenario 1 has reached its projected target. We are currently tracking the price action to validate the conditions for Scenario 2.📊 CryptoPilot – Advanced Technical Analysis for BTC & Altcoins
🔎 Smart Money • Price Action • NeoWave • Multi-Timeframe Context
📩 Contact: @CryptoPilot_1 (Telegram)
📥 Telegram Chanell : @CryptoPilot_Trading
🔎 Smart Money • Price Action • NeoWave • Multi-Timeframe Context
📩 Contact: @CryptoPilot_1 (Telegram)
📥 Telegram Chanell : @CryptoPilot_Trading
Penerbitan berkaitan
Penafian
Maklumat dan penerbitan adalah tidak bertujuan, dan tidak membentuk, nasihat atau cadangan kewangan, pelaburan, dagangan atau jenis lain yang diberikan atau disahkan oleh TradingView. Baca lebih dalam Terma Penggunaan.
📊 CryptoPilot – Advanced Technical Analysis for BTC & Altcoins
🔎 Smart Money • Price Action • NeoWave • Multi-Timeframe Context
📩 Contact: @CryptoPilot_1 (Telegram)
📥 Telegram Chanell : @CryptoPilot_Trading
🔎 Smart Money • Price Action • NeoWave • Multi-Timeframe Context
📩 Contact: @CryptoPilot_1 (Telegram)
📥 Telegram Chanell : @CryptoPilot_Trading
Penerbitan berkaitan
Penafian
Maklumat dan penerbitan adalah tidak bertujuan, dan tidak membentuk, nasihat atau cadangan kewangan, pelaburan, dagangan atau jenis lain yang diberikan atau disahkan oleh TradingView. Baca lebih dalam Terma Penggunaan.