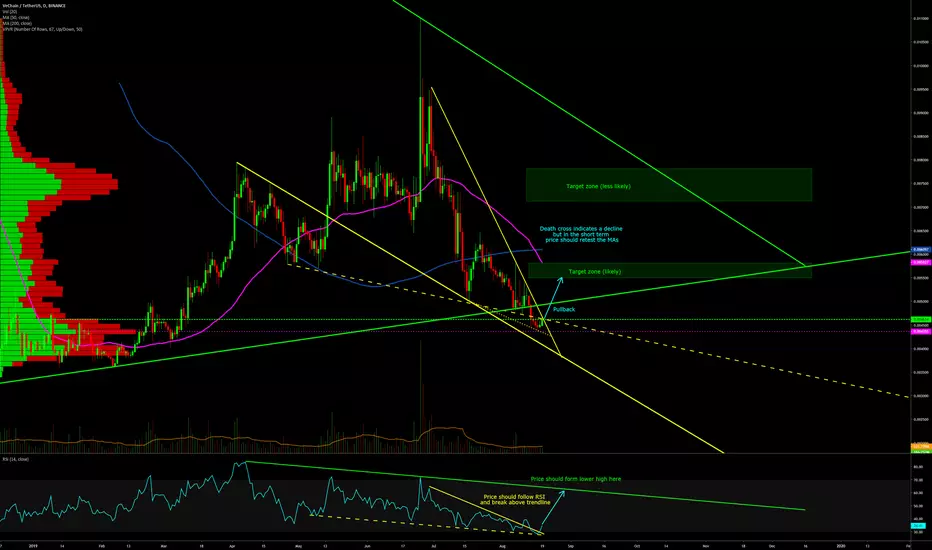
Since my last VET chart price has declined and found support at the average price volume (pink dotted). Now VET must break above the downtrend (yellow) and back above long term support (green). It's quite common for pullbacks that breached long term supports to break above with little resistance. However, this signifies that price may easily break below it again and head lower (as indicated by the death cross). I believe that price could decline lower in the mid to longer term but in the short term price should recover ~20% to the likely target zone.
VET has the potential to pump hard and should it I placed a secondary target zone that's less likely to trigger.
VET has the potential to pump hard and should it I placed a secondary target zone that's less likely to trigger.
Nota
VET is retesting avg. price volume support (pink dotted) as well as the yellow dotted trendline. This is still within the trading structure. If it drops below, the next support is the thicker solid yellow down trendline which is part of the descending wedge. Stoploss under that is essential because if that support fails then it means BTC is crashing hard and alts are going to be slaughtered.Dagangan aktif
Price broke above the descending wedge.
Nota
VET/BTC pair broke out of its descending wedge as well. Target zone for that pairing is 25-58% which aligns perfectly with the two VET/USDT target zones.
Penerbitan berkaitan
Penafian
Maklumat dan penerbitan adalah tidak dimaksudkan untuk menjadi, dan tidak membentuk, nasihat untuk kewangan, pelaburan, perdagangan dan jenis-jenis lain atau cadangan yang dibekalkan atau disahkan oleh TradingView. Baca dengan lebih lanjut di Terma Penggunaan.
Penerbitan berkaitan
Penafian
Maklumat dan penerbitan adalah tidak dimaksudkan untuk menjadi, dan tidak membentuk, nasihat untuk kewangan, pelaburan, perdagangan dan jenis-jenis lain atau cadangan yang dibekalkan atau disahkan oleh TradingView. Baca dengan lebih lanjut di Terma Penggunaan.