Took a buy on the bullish retest as price is in major downtrend.
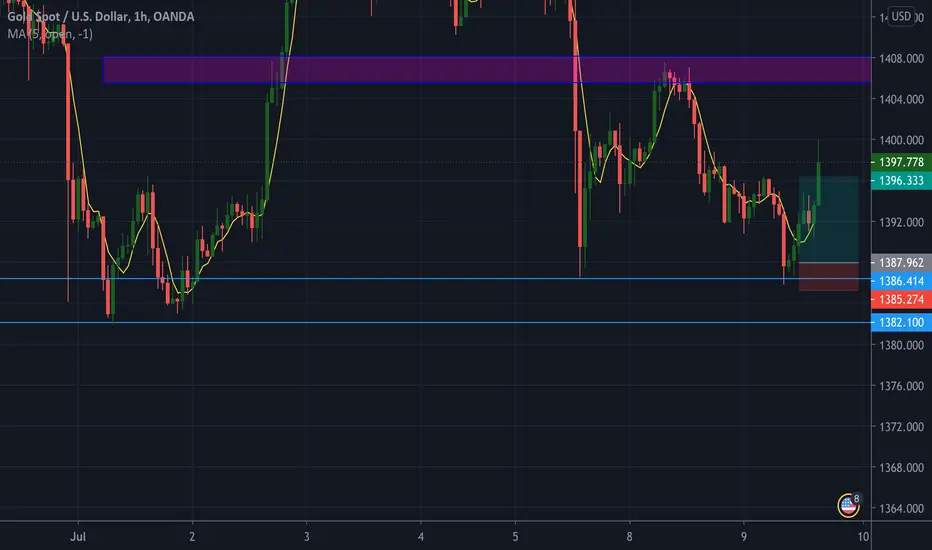
Now looking at the Gold/USD hourly & 15 min charts on July 9th 2019. Gold has been in a bearish trend since July 3rd, after reaching 6 year high at 1438.900 zone. Going to a higher timeframe, in the daily, we see that price could Not top this high after attempting to breakthrough twice. Once on June 25th & again on July 3rd ( 5 candles in between).
Price has been creating lower highs & lower lows since the 3rd of July, indicating down trend. 3 bearish candles appear after not being able to break high. With price currently at 1397.778 I am now looking for sells down to the 1382.100 zone after retest.
Using the Fibonacci retracement tool, I will set my tp & sl respecting its support & resistance levels.
Penafian
Maklumat dan penerbitan adalah tidak dimaksudkan untuk menjadi, dan tidak membentuk, nasihat untuk kewangan, pelaburan, perdagangan dan jenis-jenis lain atau cadangan yang dibekalkan atau disahkan oleh TradingView. Baca dengan lebih lanjut di Terma Penggunaan.
Penafian
Maklumat dan penerbitan adalah tidak dimaksudkan untuk menjadi, dan tidak membentuk, nasihat untuk kewangan, pelaburan, perdagangan dan jenis-jenis lain atau cadangan yang dibekalkan atau disahkan oleh TradingView. Baca dengan lebih lanjut di Terma Penggunaan.