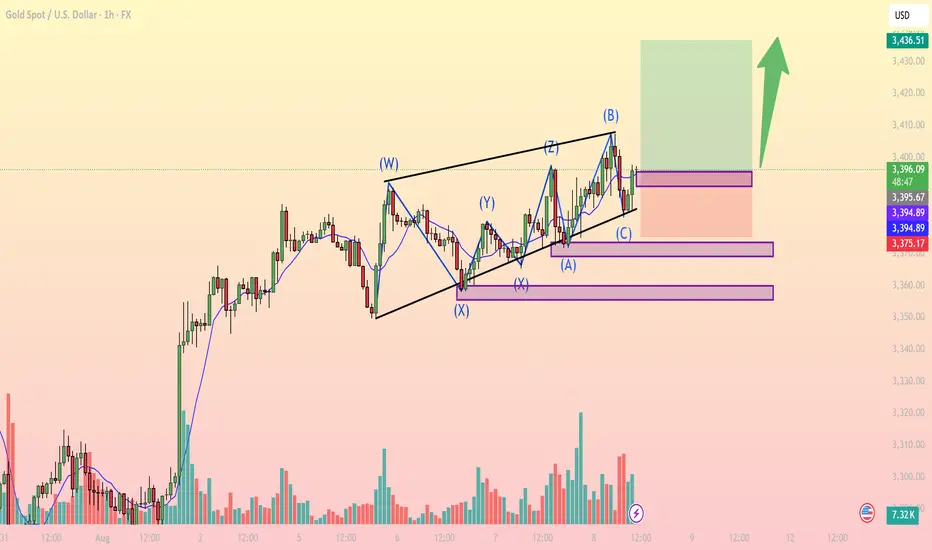
XAUUSD August 8: Gold completes corrective structure – Buy opportunity on breakout
On the 1H chart, Gold (XAUUSD) has been consolidating within a complex WXYXZ corrective pattern following the strong bullish rally from August 1st. The recent (A)(B)(C) correction within wave Z appears to have completed, with price currently bouncing from a key demand zone around 3,394 – 3,395 USD.

Key bullish signals:
Corrective pattern completed: Wave (C) touched the lower trendline and showed a bullish reaction, suggesting end of the correction.
EMA bounce: Price is finding support from the short-term EMA, indicating a potential return of bullish momentum.
Rising volume: Especially after testing the 3,375 support zone, buying volume has increased, confirming accumulation.
Fibonacci confluence: The 3,394 level aligns with the 61.8% retracement of the previous bullish leg – a strong support zone for long entries.
Important price levels:
Immediate support: 3,394 – 3,395 (ideal buy zone).
Stronger support: 3,375 (stop-loss placement).
Resistance / Take Profit: 3,436 (previous high and supply zone).
Suggested Trading Strategy:
Bias: Long (Buy)
Entry: 3,395
Stop-loss: 3,375
Target: 3,436
Risk/Reward Ratio: ~1.99 – solid for an intraday setup.
Note: If price breaks below 3,375 with high volume, consider exiting early to avoid deeper downside toward 3,333.
Conclusion: Gold is likely resuming its uptrend after a complex corrective phase. This presents a potential long opportunity with a favorable risk/reward ratio if executed properly within the marked levels.
Follow for more high-quality trading setups – and don’t forget to save this idea if it fits your trading plan.
On the 1H chart, Gold (XAUUSD) has been consolidating within a complex WXYXZ corrective pattern following the strong bullish rally from August 1st. The recent (A)(B)(C) correction within wave Z appears to have completed, with price currently bouncing from a key demand zone around 3,394 – 3,395 USD.
Key bullish signals:
Corrective pattern completed: Wave (C) touched the lower trendline and showed a bullish reaction, suggesting end of the correction.
EMA bounce: Price is finding support from the short-term EMA, indicating a potential return of bullish momentum.
Rising volume: Especially after testing the 3,375 support zone, buying volume has increased, confirming accumulation.
Fibonacci confluence: The 3,394 level aligns with the 61.8% retracement of the previous bullish leg – a strong support zone for long entries.
Important price levels:
Immediate support: 3,394 – 3,395 (ideal buy zone).
Stronger support: 3,375 (stop-loss placement).
Resistance / Take Profit: 3,436 (previous high and supply zone).
Suggested Trading Strategy:
Bias: Long (Buy)
Entry: 3,395
Stop-loss: 3,375
Target: 3,436
Risk/Reward Ratio: ~1.99 – solid for an intraday setup.
Note: If price breaks below 3,375 with high volume, consider exiting early to avoid deeper downside toward 3,333.
Conclusion: Gold is likely resuming its uptrend after a complex corrective phase. This presents a potential long opportunity with a favorable risk/reward ratio if executed properly within the marked levels.
Follow for more high-quality trading setups – and don’t forget to save this idea if it fits your trading plan.
🪙 JOIN OUR FREE TELEGRAM GROUP 🪙
t.me/dnaprofits
Join the community group to get support and share knowledge!
️🥇 Exchange and learn market knowledge
️🥇 Support free trading signals
t.me/dnaprofits
Join the community group to get support and share knowledge!
️🥇 Exchange and learn market knowledge
️🥇 Support free trading signals
Penerbitan berkaitan
Penafian
Maklumat dan penerbitan adalah tidak dimaksudkan untuk menjadi, dan tidak membentuk, nasihat untuk kewangan, pelaburan, perdagangan dan jenis-jenis lain atau cadangan yang dibekalkan atau disahkan oleh TradingView. Baca dengan lebih lanjut di Terma Penggunaan.
