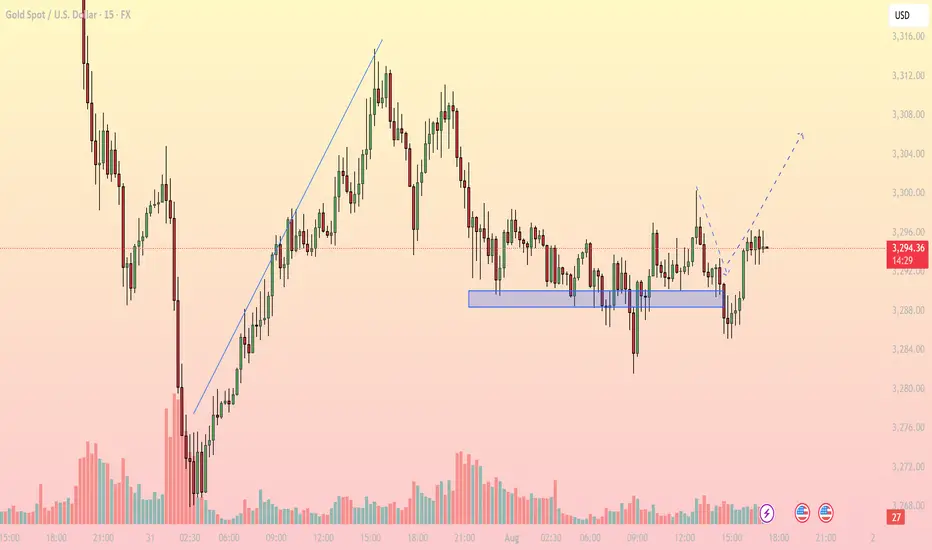
Market Overview: On the M15 timeframe, XAUUSD shows signs of a short-term bullish reversal after a prolonged sideways range around the key support zone of 3,286 – 3,289 USD. Price faked out below this support but quickly recovered, forming a V-shape reversal, suggesting strong buying interest has returned.

Key Levels to Watch:
Support Zones:
- 3,286 – 3,289: Strong intraday support, tested multiple times with sharp rejections
- 3,274: Next significant support if the above zone fails
Resistance Zones:
- 3,300 – 3,304: First resistance target aligned with the recent high
- 3,308 – 3,312: Higher resistance area where supply may emerge
Technical Indicators:
EMA: Price has reclaimed the short-term EMAs, indicating bullish momentum on lower timeframes
RSI: Rising above 50 but not yet overbought – there’s room for further upside
Volume: Increasing volume during the bounce confirms buying strength
Trading Strategy:
- Bullish Scenario (Preferred): Entry Zone: Watch for pullback toward 3,290 – 3,292
Stop Loss: Below 3,285
Take Profit 1: 3,300
Take Profit 2: 3,304
Extended Target: 3,308 – 3,312 (if bullish momentum continues beyond breakout zone)
- Bearish Scenario (Alternate): Only valid if price breaks and closes strongly below 3,286
Short Target: 3,274 – 3,270
Note: Counter-trend strategy – higher risk, requires strong confirmation
Conclusion: Gold is showing a bullish price structure on the 15-minute chart. As long as price holds above the 3,286 – 3,289 support zone, the path of least resistance appears to be upward, with 3,300 and 3,304 as the next logical targets. Monitor price action closely during the U.S. session for a potential long setup.
- Follow for more real-time gold trading strategies and save this idea if you find it helpful!
Dagangan aktif
Follow for more high-quality trading strategies.🪙 JOIN OUR FREE TELEGRAM GROUP 🪙
t.me/dnaprofits
Join the community group to get support and share knowledge!
️🥇 Exchange and learn market knowledge
️🥇 Support free trading signals
t.me/dnaprofits
Join the community group to get support and share knowledge!
️🥇 Exchange and learn market knowledge
️🥇 Support free trading signals
Penerbitan berkaitan
Penafian
Maklumat dan penerbitan adalah tidak dimaksudkan untuk menjadi, dan tidak membentuk, nasihat untuk kewangan, pelaburan, perdagangan dan jenis-jenis lain atau cadangan yang dibekalkan atau disahkan oleh TradingView. Baca dengan lebih lanjut di Terma Penggunaan.
🪙 JOIN OUR FREE TELEGRAM GROUP 🪙
t.me/dnaprofits
Join the community group to get support and share knowledge!
️🥇 Exchange and learn market knowledge
️🥇 Support free trading signals
t.me/dnaprofits
Join the community group to get support and share knowledge!
️🥇 Exchange and learn market knowledge
️🥇 Support free trading signals
Penerbitan berkaitan
Penafian
Maklumat dan penerbitan adalah tidak dimaksudkan untuk menjadi, dan tidak membentuk, nasihat untuk kewangan, pelaburan, perdagangan dan jenis-jenis lain atau cadangan yang dibekalkan atau disahkan oleh TradingView. Baca dengan lebih lanjut di Terma Penggunaan.